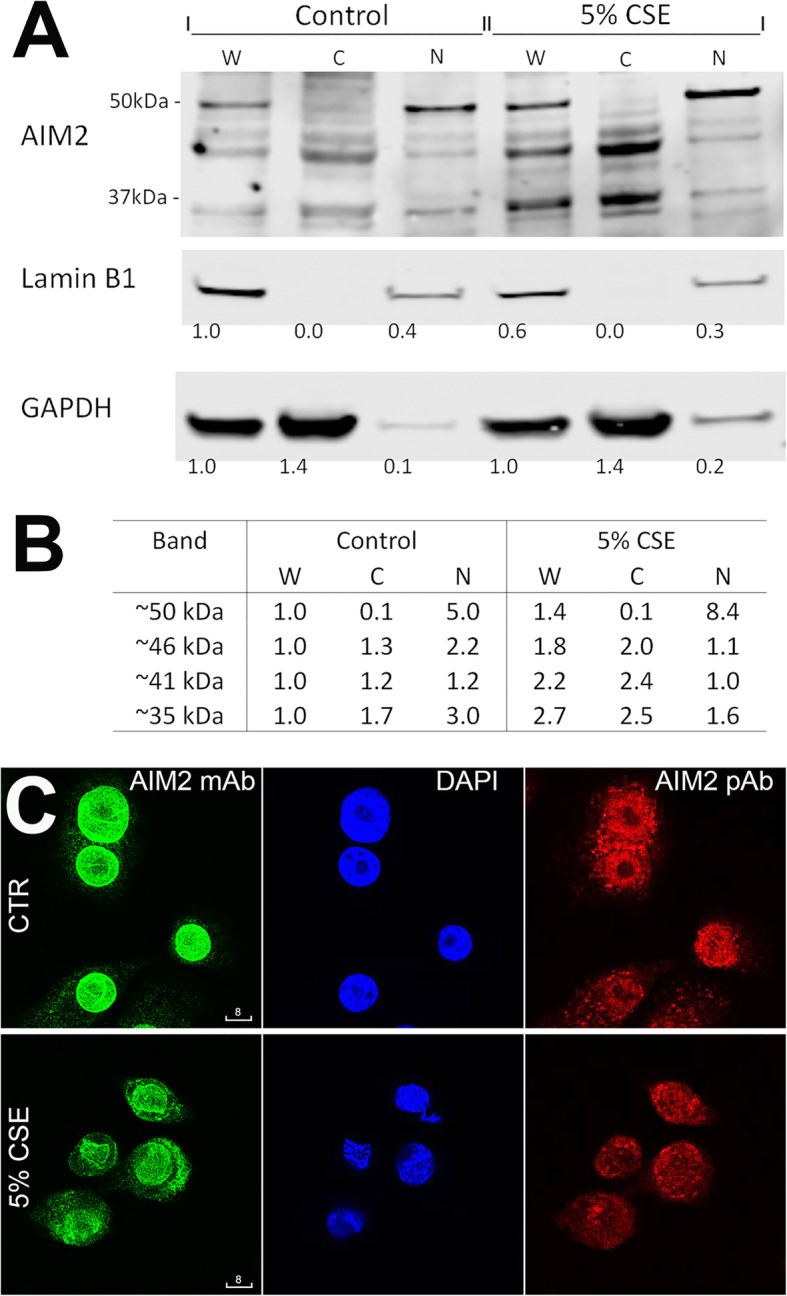
Fig. 8.

Nuclear-to-cytoplasmic redistribution of AIM2 in cigarette smoke extract- (CSE-) stimulated HBEC30KT cells. a: Representative Western blots analysis of AIM2 in whole cell lysate(W), cytoplasmic (c) and nuclear fractions (N) (n = 2). b Comparison of band abundance between CSE-stimulated and control. Band abundance was normalized to the corresponding band in the whole cell lysate and adjusted to GAPDH (cytoplasmic) or Lamin B1 (nuclear) expression. c Representative confocal images of HBEC30KT, control vs. CSE-stimulated (n = 2). Green: mouse mAb (Ab5); Red: rabbit pAb (Ab1). Blue: DAPI. Scale bars are in micrometers
