
FIGURE 2.
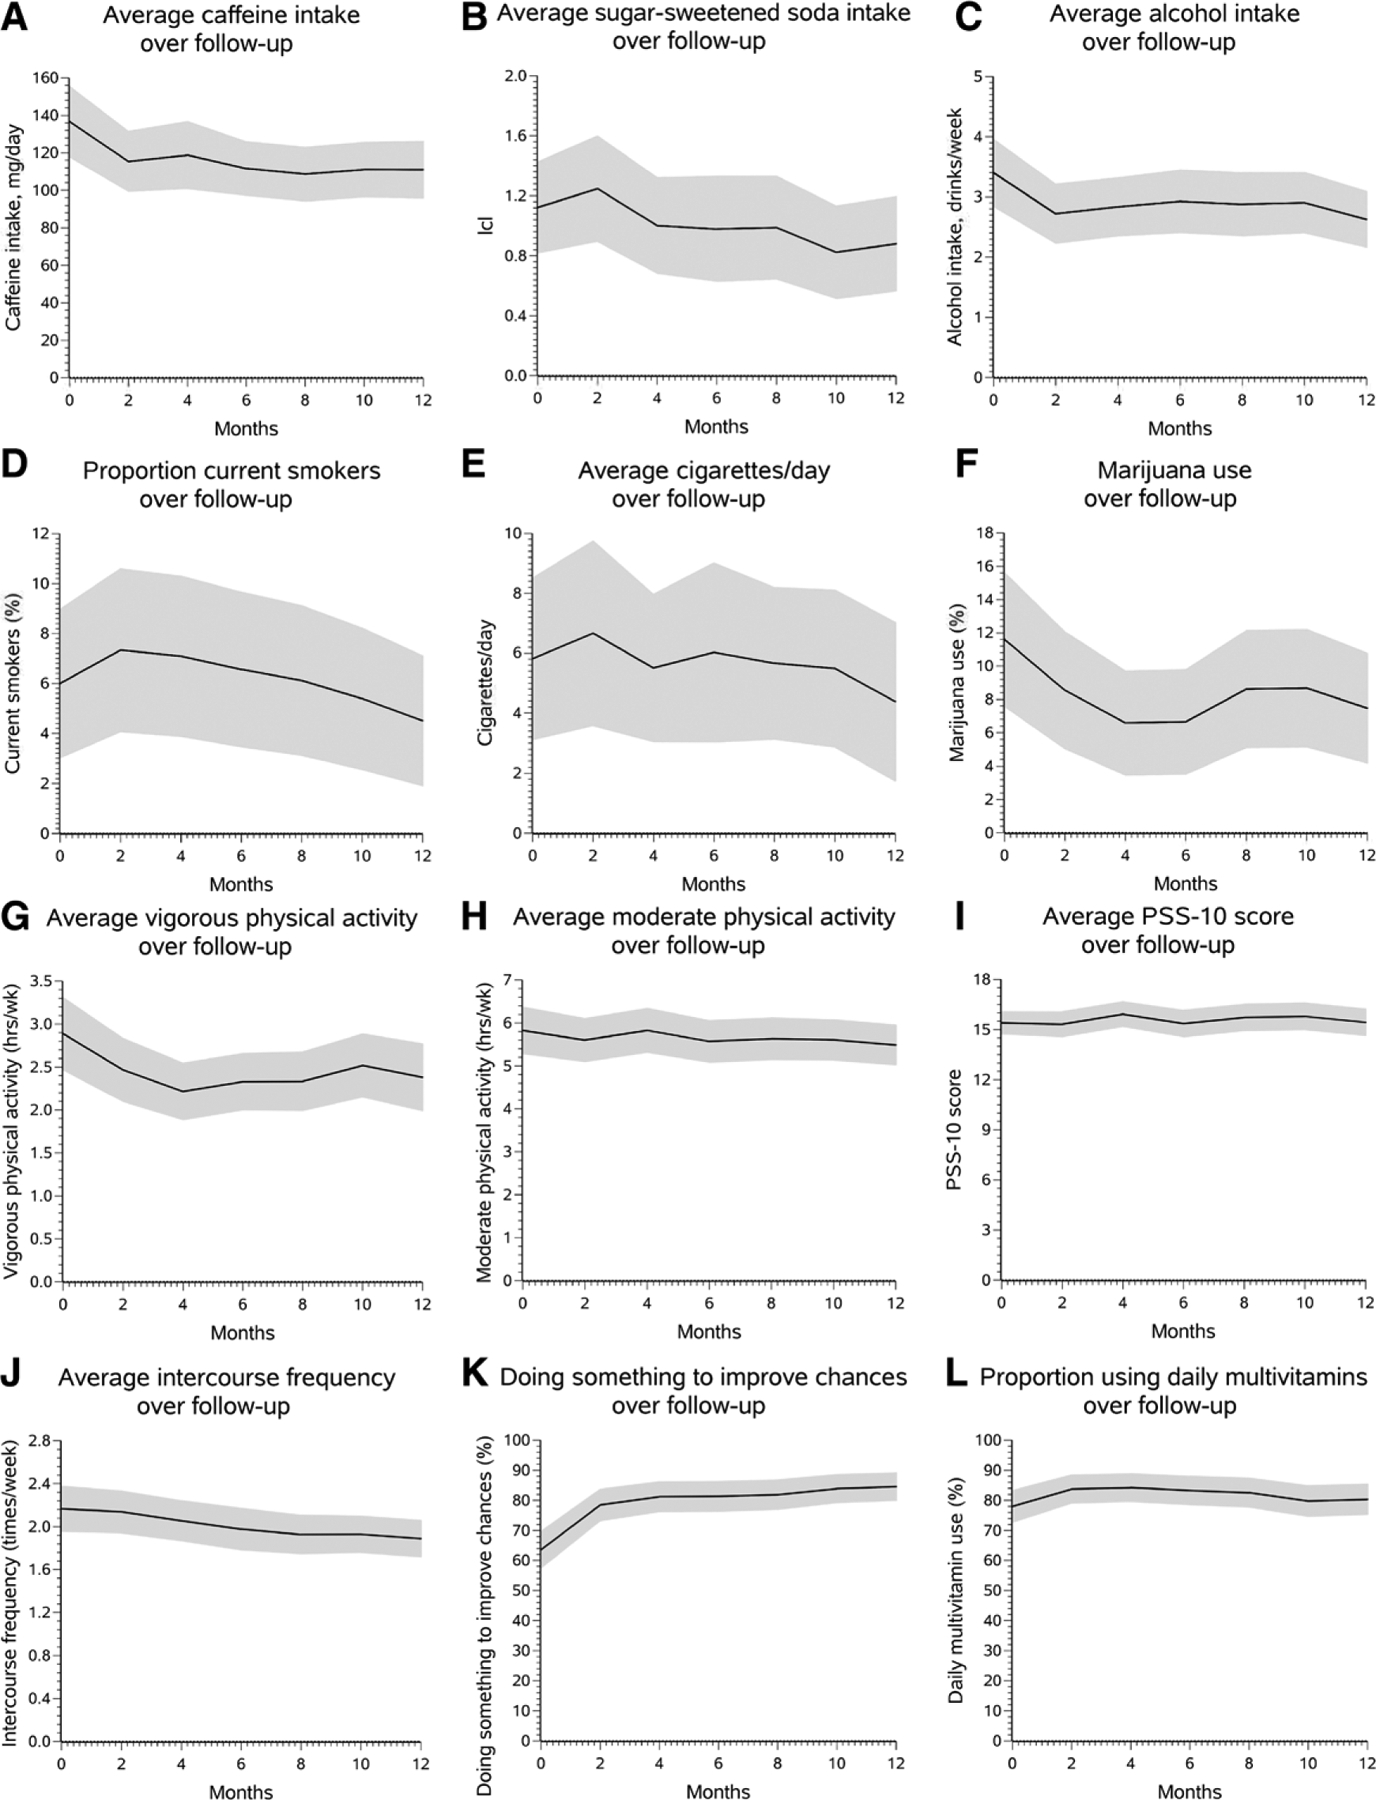
A–L, Trajectories in behavior among the 250 women who completed 12 months of follow-up. Solid line, Mean value of characteristic weighted to adjust for loss to follow-up; shaded area, 95% confidence bounds.
Official websites use .gov
A
.gov website belongs to an official
government organization in the United States.
Secure .gov websites use HTTPS
A lock (
) or https:// means you've safely
connected to the .gov website. Share sensitive
information only on official, secure websites.
A–L, Trajectories in behavior among the 250 women who completed 12 months of follow-up. Solid line, Mean value of characteristic weighted to adjust for loss to follow-up; shaded area, 95% confidence bounds.