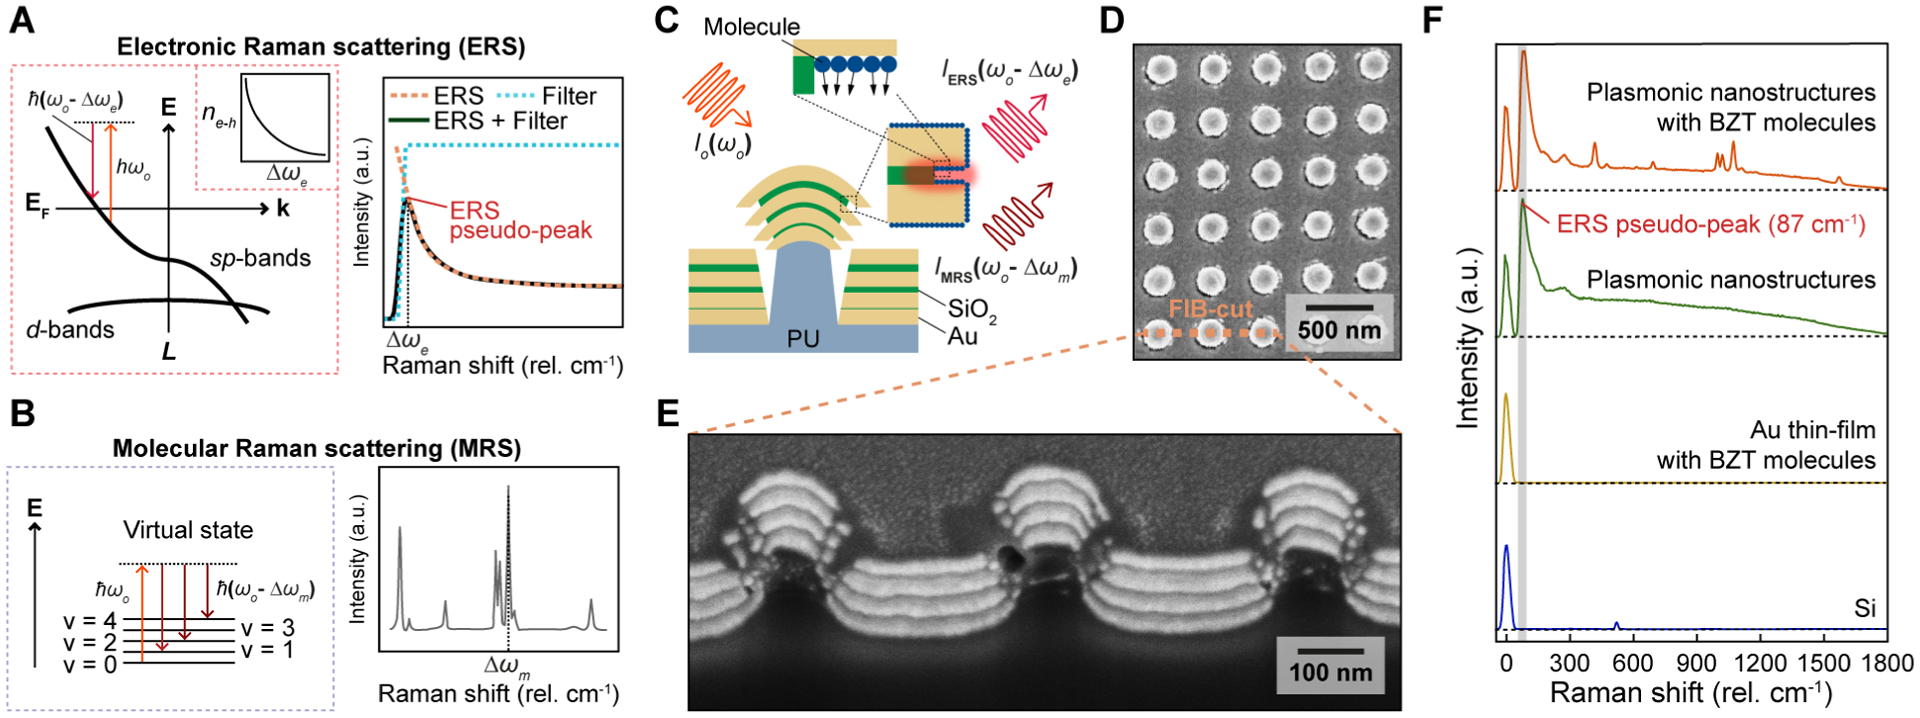
Figure 1.

Plasmonic enhancement of ERS and MRS signals at hotspots. (A) Energy-diagram illustration of the ERS process (left) and the ERS pseudo-peak spectrum (right). Inset (left): the volume density spectrum of electron-hole pairs ne−h. (B) Energy-diagram illustration of the MRS process (left) and the measured Raman peaks of molecules (right). (C) Scheme of plasmon-enhanced ERS and MRS processes at hotspot regions from nanolaminate SERS substrates. PU, polyurethane; (D) Top and (E) cross-sectional view SEM images of the nanolaminate SERS substrates. FIB, focused-ion-beam; (F) The measured Raman spectra for four different samples.
