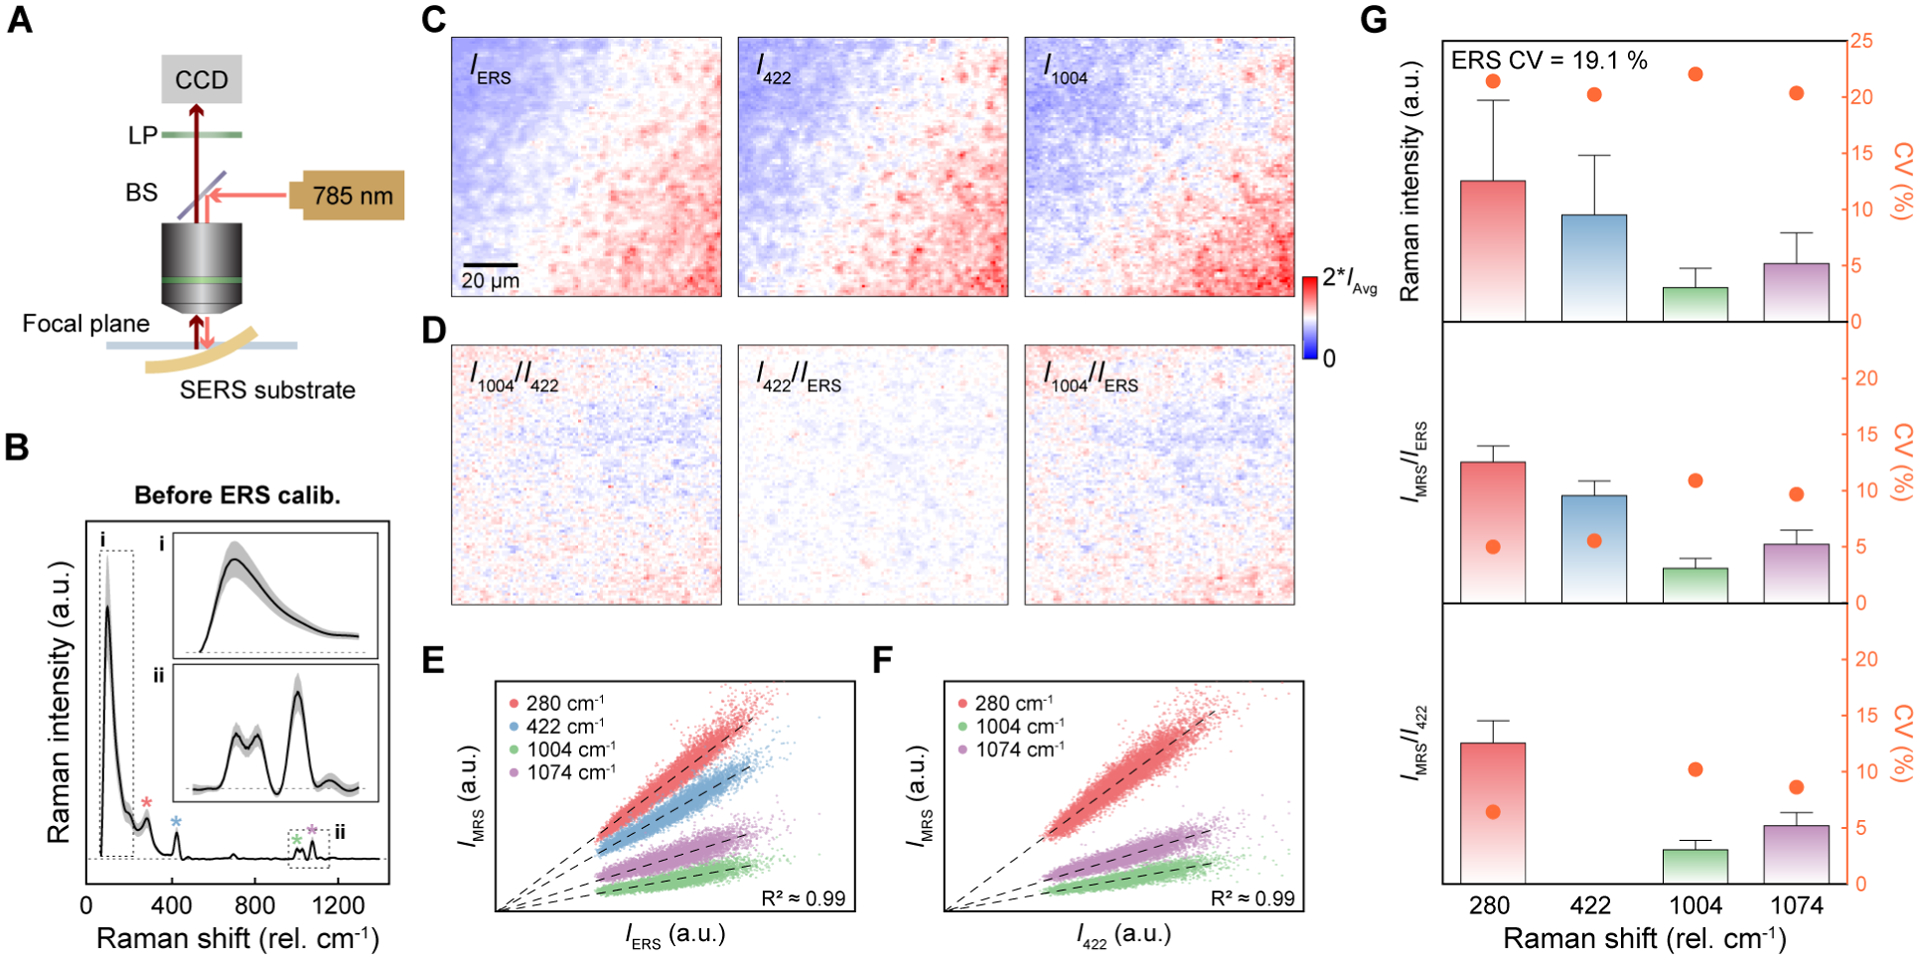
Figure 2.

Spatially-correlated linear dependence between ERS and MRS signals. (A) Schematic illustration of the experimental setup for varying excitation laser focusing conditions by mechanical deformation of the SERS substrates. CCD, charge-coupled device; LP, long-pass filter; BS, beam splitter; (B) Average BZT SERS spectrum with SD (gray regions) from 10,000 pixels before ERS calibration. (C) 2D Raman images for IERS, I422 and I1004. (D) 2D Raman images of I1004/I422 by MRS calibration and I422/IERS and I1004/IERS by ERS calibration. (E–F) The scatter plots of IMRS as a function of (E) IERS and (F) I422. (G) Quantitative statistical analysis for before ERS calibration (top), after ERS calibration (middle), and MRS calibration by 422 cm−1 (bottom). The error bars for the intensity bars are 1.5 IQR from 10,000 pixels.
