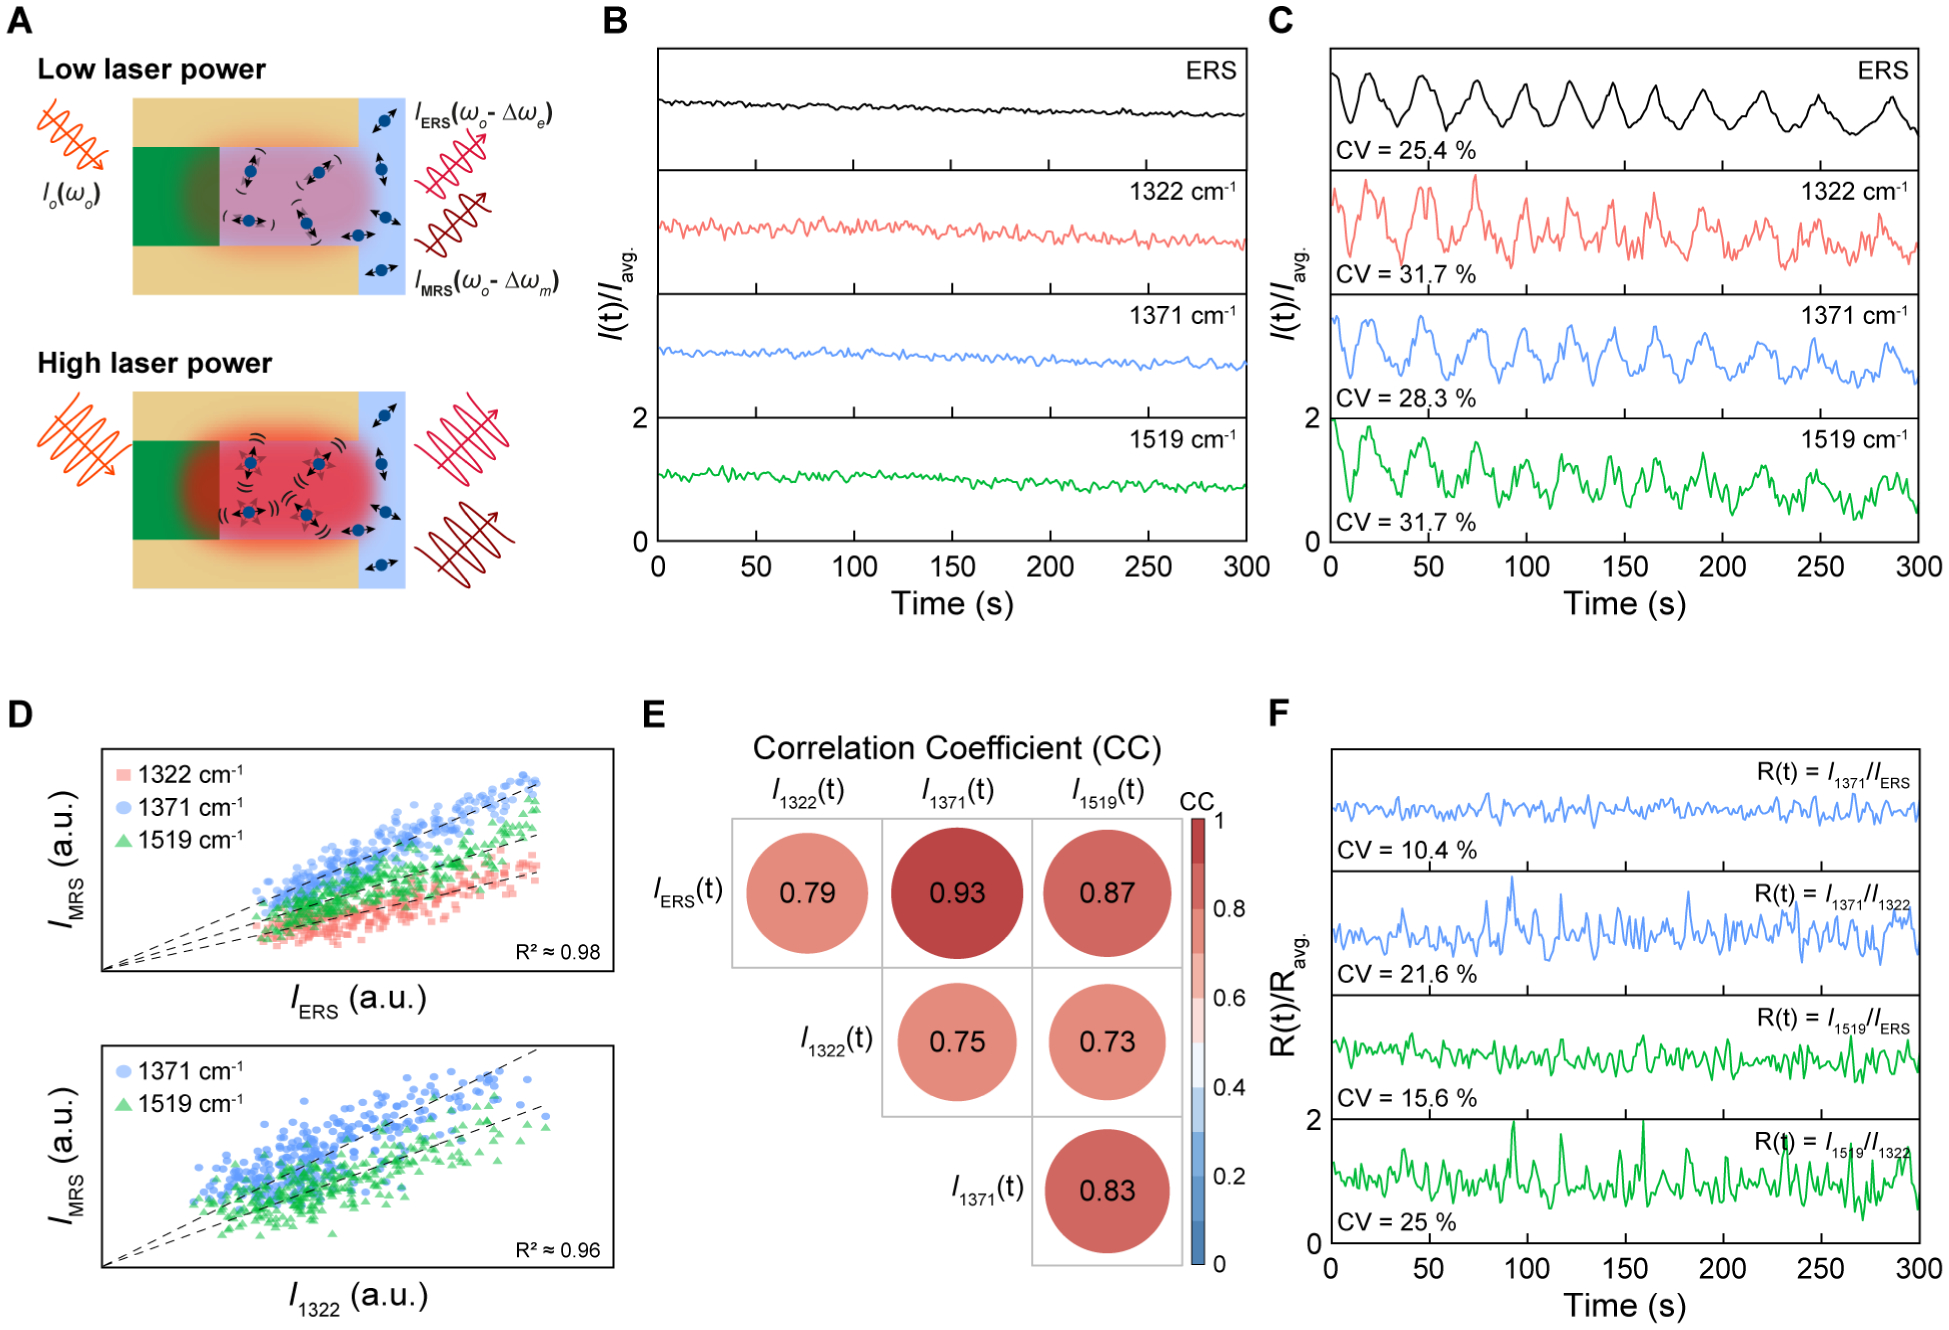
Figure 4.

ERS temporal calibration for time-resolved SERS measurements. (A) Schematic illustration of the microscopic environment of the hotspots under laser excitation of low and high powers. (B–C) Time-trajectories of ERS signals at 87 cm−1 and three MRS signals at 1322 cm−1, 1371 cm−1, and 1519 cm−1 (B) without and (C) with dynamic modulations of laser excitation powers. (D) The scatter plots of IMRS as a function of IERS (top) and I1322 (bottom). (E) A matrix of calculated correlation coefficients (CC) among ERS and MRS signals. (F) Time-trajectories of 1371 cm−1 and 1519 cm−1 modes by ERS calibration at 87 cm−1 and the MRS calibration at 1322 cm−1.
