Figure 1.
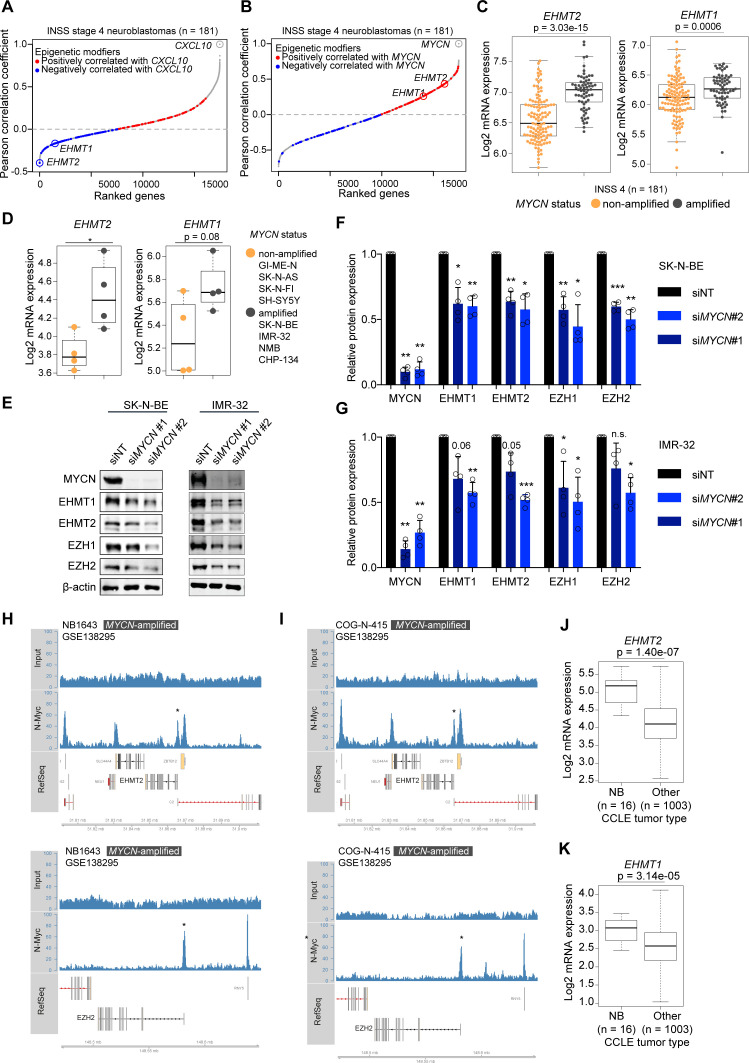
Euchromatic histone methyltransferases (EHMTs) as inversely regulated genes with CXCL10 level in high-risk neuroblastomas and its association with MYCN amplification. (A) Genes correlating with CXCL10 expression in INSS 4 NBs ranked by increasing Pearson correlation coefficients. Epigenetic modifiers from Xu et al30 are highlighted. Red: positively correlated; blue: negatively correlated. (B) As in (A) but showing genes correlating with MYCN expression. (C) Boxplots showing EHMT2 and EHMT1 expression (RNA-seq, log2) in INSS 4 NBs by MYCN status. (D) Boxplots showing EHMT2 and EHMT1 expression (3′mRNA-seq, log2) in human NB cell lines by MYCN status. (E) Western blots for MYCN, EHMT1, EHMT2, EZH1, EZH2 and β-actin in siMYCN or non-targeting non-targeting siRNA (siNT)-treated SK-N-BE and IMR-32 cells. Representative blots of biological replicates (n=4). (F, G) Quantification of experiment described in (E) from biological replicates (n=4). Error bars; SD. (H) and (I) MYCN-binding peaks in the genomic regions of EHMT2 (upper panels) and EZH2 (lower panel) by ChIP-seq. Cell lines and data set as indicated. (J) and (K) EHMT2 and EHMT1 expression in NB cells versus other cancer cells from the CCLE database. Statistics: two-sided unpaired t-tests (C, D, J, K). Two-sided unpaired t-test with logarithmic values (F, G). Boxplots: Boxes indicate second and third quartile. Bars indicate first and fourth quartile. Horizontal line represents median. *p<0.05; **p<0.01; ***p<0.001. Otherwise p values as indicated. NB, neuroblastoma.

