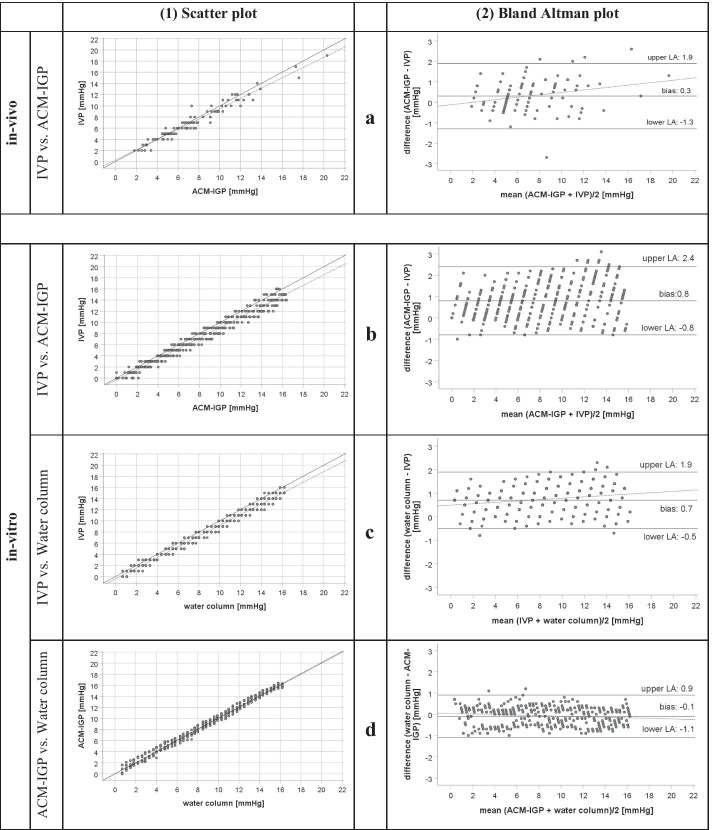
Fig. 2.
In vivo and in vitro measurements. Presentation of measurement agreement between IVP and ACM-IGP measurements in vivo (a) and in vitro (b–d). a Scatter plot and Bland–Altman plot of in vivo measurements. a1 Scatter plot of paired IAP measurements obtained by novel ACM-IGP and IVP (reference method) with the solid line representing linear regression and the dashed line representing the line of identity. a2 Bland–Altman plot of IVP and ACM-IGP. Mean bias ± precision between IVP and ACM-IGP was 0.3 ± 0.8 mmHg; limits of agreement (LOA) were − 1.3 to 1.9 mmHg. The dashed line represents the best-fit straight line, which increases slightly with rising IAP. b–d Scatter plots and Bland–Altman plots of in vitro measurements in a container model. In all scatter plots the solid line is representing linear regression and the dashed line the line of identity. b1 Scatter plot of paired pressure measurements obtained by IVP and ACM-IGP. b2 Bland–Altman plot: Mean bias ± precision was 0.8 ± 0.8 mmHg; LOA were − 0.8 to 2.4 mmHg. The dashed line represents the best-fit straight line, which is parallel to mean bias. c1 Scatter plot of paired pressure measurements obtained by IVP and water column (gold standard). c2 Bland–Altman plot: Mean bias ± precision was 0.7 ± 0.6 mmHg; LOA were − 0.5 to 1.9 mmHg. The dashed best-fit straight line increases slightly with rising pressures. d1 Scatter plot of paired pressure measurements obtained by ACM-IGP and water column. d2 Bland–Altman plot: Mean bias ± precision was − 0.1 ± 0.5 mmHg; LOA were − 1.1 to 0.9 mmHg. The dashed best-fit straight line increases slightly with rising pressures

