Figure 2:

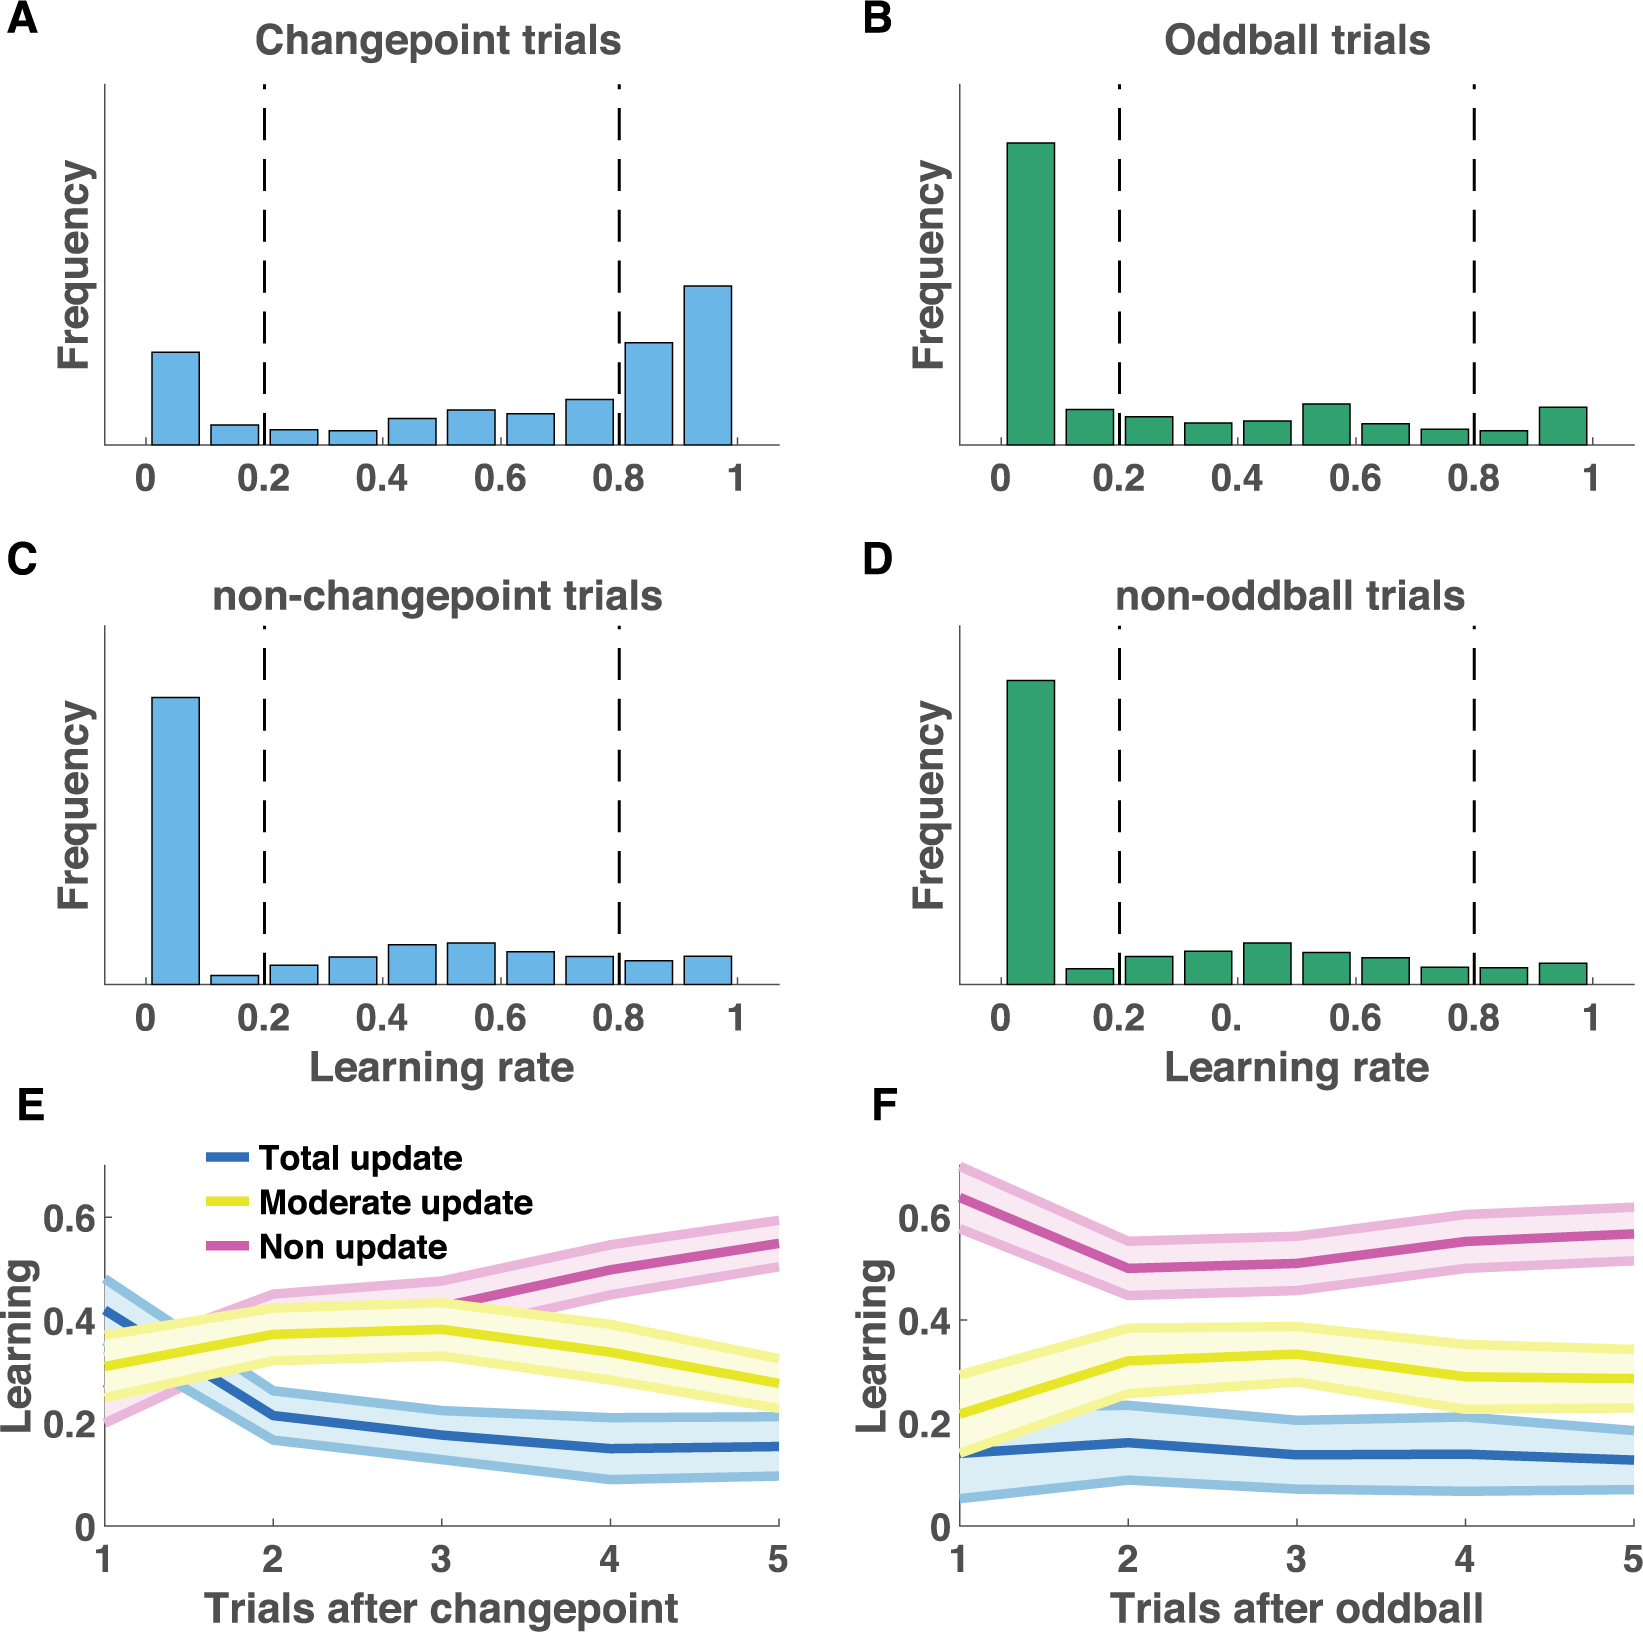
Participant learning rates were sensitive to task condition and surprising outcomes. A-D) Single trial learning rate frequency histograms for changepoint (A) and oddball (B) trials, as well as for non-changepoint (C) and non-oddball (D) trials. Single trial learning rates are categorized into three types: non updates, moderate updates, and total updates, depending on their value with respect to criterion values (dotted vertical lines). E-F) Mean/SEM proportion of each category of learning rates used as a function of time since the previous surprising event [changepoint (E) or oddball (F)].
