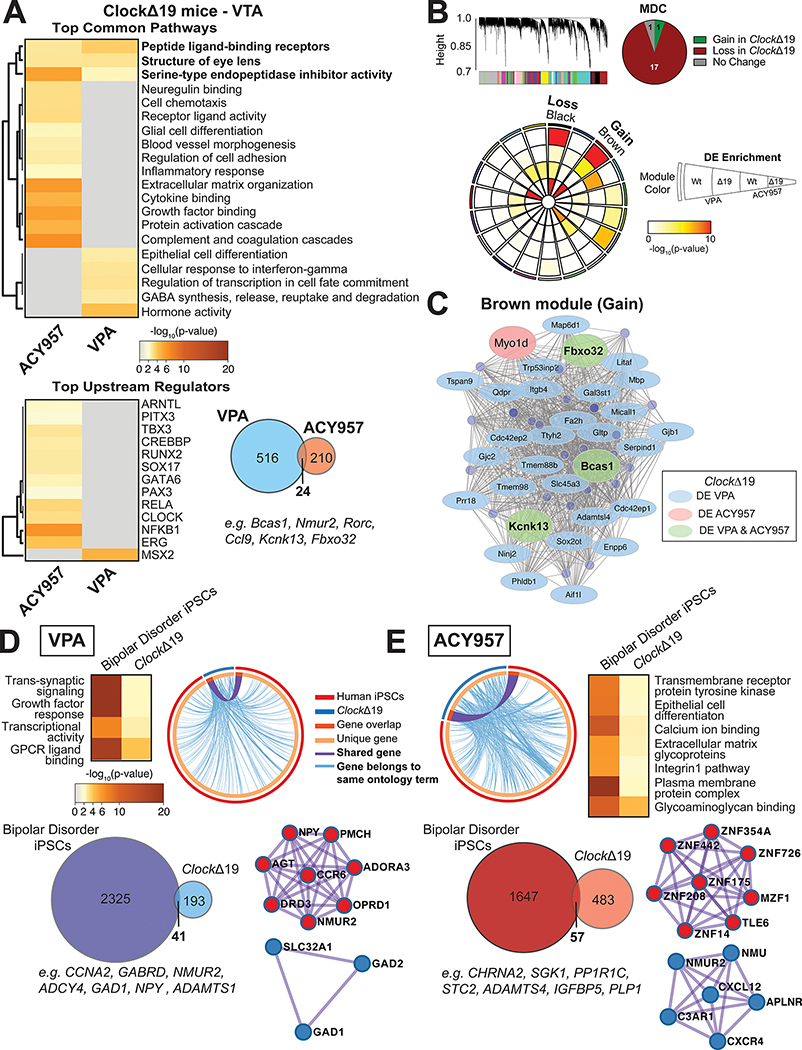
Figure 5.
The effects of VPA and ACY957 on the VTA transcriptome of ClockΔ19 mutant mice and patient derived human iPSCs. Top pathways and upstream regulators enriched in ClockΔ19 mutant mice treated with either VPA or the class I HDAC inhibitor, ACY957 (A). Overlap of top differentially expressed (DE) transcripts in ClockΔ19 mutant mice treated with VPA relative to ACY957 (A) and the top upstream regulators enriched from the 24 DE transcripts similarly altered by VPA and ACY957 (p<0.05 and logFC ≤−0.26 and ≥0.26). Weighted gene co-expression network analysis (WGCNA) was used to generate co-expression modules, with the network structure built on all samples from wild-type (Wt) and ClockΔ19 mutant mice (B). The 19 modules that survived module preservation analysis were assigned colors and the dendrogram depicts the average linkage of hierarchical clustering of genes. Pie chart summarizes the results from module differential connectivity (MDC) analysis, where there were more modules lost in ClockΔ19 mutant mice than gained. Circos plot depicts 19 WGCNA modules. Enrichment of DE genes for treatments and genotypes are indicated by the semi-circle colors within each module, with increasing warm colors indicating increasing -log10(pvalue). The black and brown modules were particularly interesting, as the MDC analysis indicated that these were lost or gained in ClockΔ19 mutant mice, respectively, and showed DE enrichment for treatments in ClockΔ19 mutant mice. Subsequent analyses focused on the single gained module labeled brown to highlight potential treatment specific pathways and regulators in ClockΔ19 mutant mice. The node size indicates the degree of connectivity for any given gene, while light blue indicates DE in VPA, light pink indicates DE in ACY957, and light green indicates DE in both treatments, only in ClockΔ19 mutant mice (C). To investigate whether there are similar changes between ClockΔ19 mutant mice and patients with bipolar disorder, neurons derived from bipolar patients who were non-responsive to lithium were cultured and treated with the bath application of VPA, ACY957, or vehicle controls for 72 hours then collected for RNAseq assays. Meta-analysis of DE transcripts from 2 patients and 2–3 clones per patient were used to analyze the top pathways and upstream regulators enriched in VPA and ACY957 treated human iPSCs (n=2 patients, 2–3 clones per patient, with 2–4 replicates per sample). Top pathways shared between human iPSCs and ClockΔ19 mice treated with VPA (D) and ACY957 (E). Circos plot revealed high degree of overlap between DE transcripts (p<0.05) in human iPSCs and the VTA of ClockΔ19 mice (light blue line) for VPA (D) and ACY957 (E). DE transcripts between human iPSCs and ClockΔ19 mice (Venn diagrams). PPI network of significant modules by Metascape for VPA (D) and ACY957 (E).

