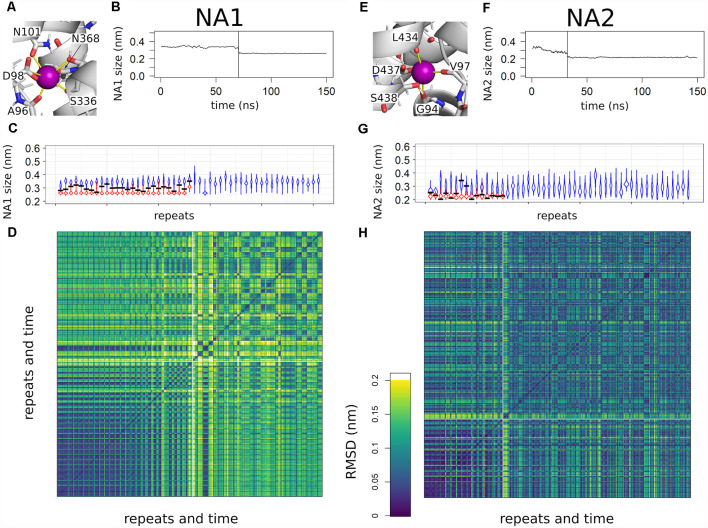
Figure 4.
Overview of sodium binding to NA1 and NA2. (A,E) Close up to NA1 and NA2. Distances used for the compactness measurement are highlighted by yellow lines. The same binding atoms are also used for the root mean square deviation (RMSD) analyses. (B,F) A representative example for the change in the compactness upon sodium binding. The time point of sodium entering NA1 or NA2 is highlighted by a vertical line. Curves are smoothed by a 1 ns running average. (C,G) Violin plots of the binding site compactness for all simulations sorted according to the time point of sodium binding to NA1 or NA2, respectively. In case of a sodium binding event, the trajectory was divided at the time of sodium binding. The violin in blue represents the pre-bound state and the violin in red shows the compactness after binding. The compactness at the time point of sodium binding is highlighted by a horizontal black line. The temporal resolution of the distance analysis was 100 ps. (D,H) RMSD analysis of all simulations sorted as in panels (C,G) of the atoms used for measuring NA1 and NA2 compactness. The boundaries between individual simulations are indicated by a black grid, while the white lines are used to separate simulations that show sodium binding from simulations in which sodium does not bind to SERT. Temporal resolution for the RMSD matrix was 10 ns.

