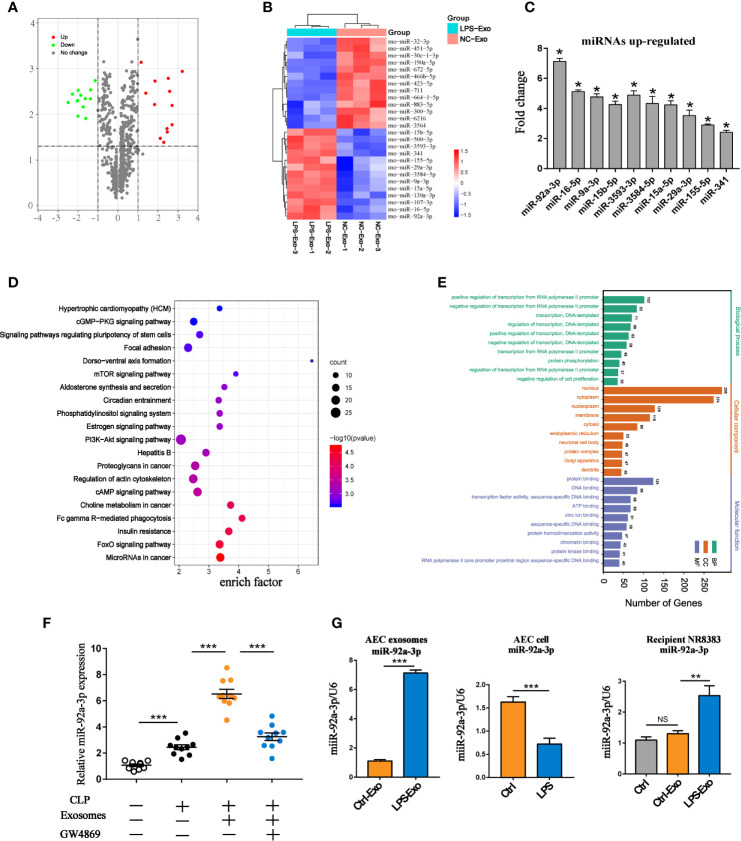
Figure 4.
miRNA expression profile of LPS-treated AEC exosomes. (A) The volcano plot of differentially expressed miRNAs between the LPS-Exo and AEC-Exo groups (fold changes ≥2 and P<0.05), compared with the Ctrl-Exo group. The miRNAs with upregulated expression are represented by red dots, those with downregulated expression arerepresented by green dots and those with non-significantly changed expression are shown as grey dots. The vertical lines correspond to upregulation or downregulation by 2-fold, and the horizontal line represents the P value of 0.05. (B) The heatmap shows the differentially expressed miRNAs. (C) Validation of the expression levels of the top 10 upregulated miRNAs in LPS-Exos. Ctrl-Exos were used as a negative control. (D, E) Kyoto Encyclopedia of Genes and Genomes (KEGG) analysis and Gene Ontology (GO) were performed on the predicted target genes of miR-92a-3p. Ctrl-Exos and LPS-Exos represent exosomes isolated from the control and LPS-treated AECs, respectively. (F) The expression of miR-92a-3p in BALF or BALF-derived exosomes isolated from the septic rats. Rats were treated with GW4869 (2.5 µg/g) through airway instillation. An hour post-treatment, CLP procedures were conducted. Sham operated rats were used as negative controls. n=10 for each group. (G) Expression of miR-92a-3p in AEC derived exosomes, AECs and recipient AMs treated with AEC derived exosomes. Data are presented as the mean ± S.E.M. *P<0.05, **P<0.01, ***P<0.001 compared Brtween two groups. NS, no significance. n=3 per group.

