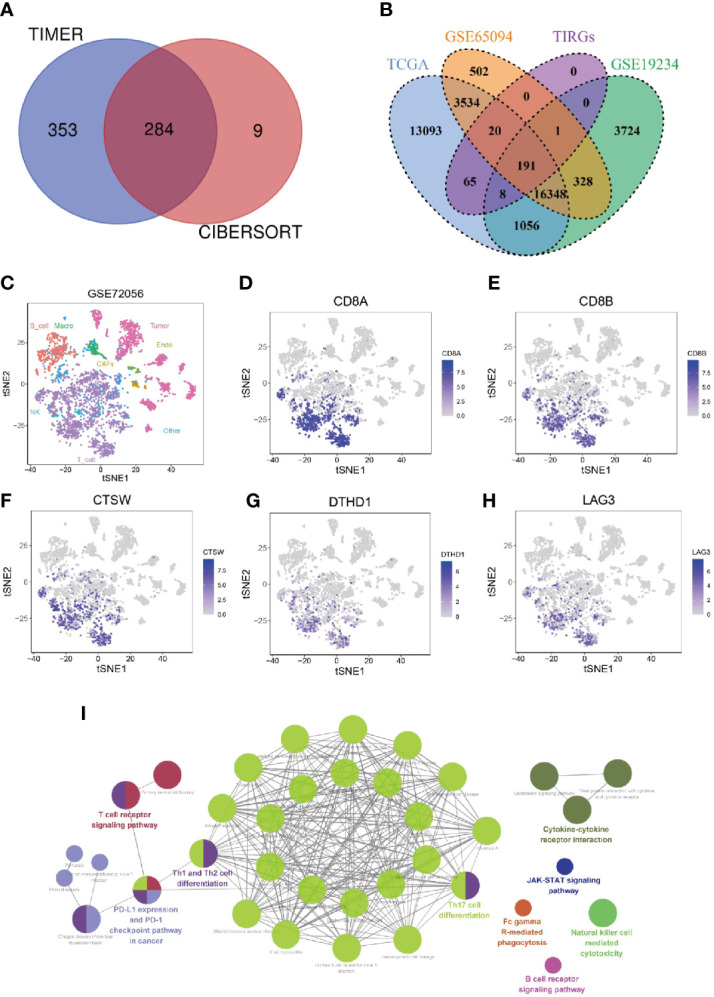
Figure 1.

Identification and enrichment analysis of TIRGs in melanoma cells. (A) Venn diagram to identify TIRGs in melanoma patients from the TCGA dataset by using TIMER and CYBERSORT. (B) Venn diagram to screen TIRGs in melanoma patients from datasets TGCA, GSE65094 and GSE19234. (C) t-SNE analysis of single cell sequencing dataset GSE72056 illustrates gene expression patterns in different cell types (shown in different colors). (D, E) The expression pattern of CD8A (D) and CD8B (E) indicates the distribution of CD8+ T cells. (F–H) Illustration of three excluded TIRGs that were highly expressed in more than 50% of CD8+ T cells but less than 10% of the remaining cells in TME: CTSW (F), DTHD1 (G) and LAG3 (H). (I) KEGG enrichment analysis of the candidate TIRGs in melanoma TME.
