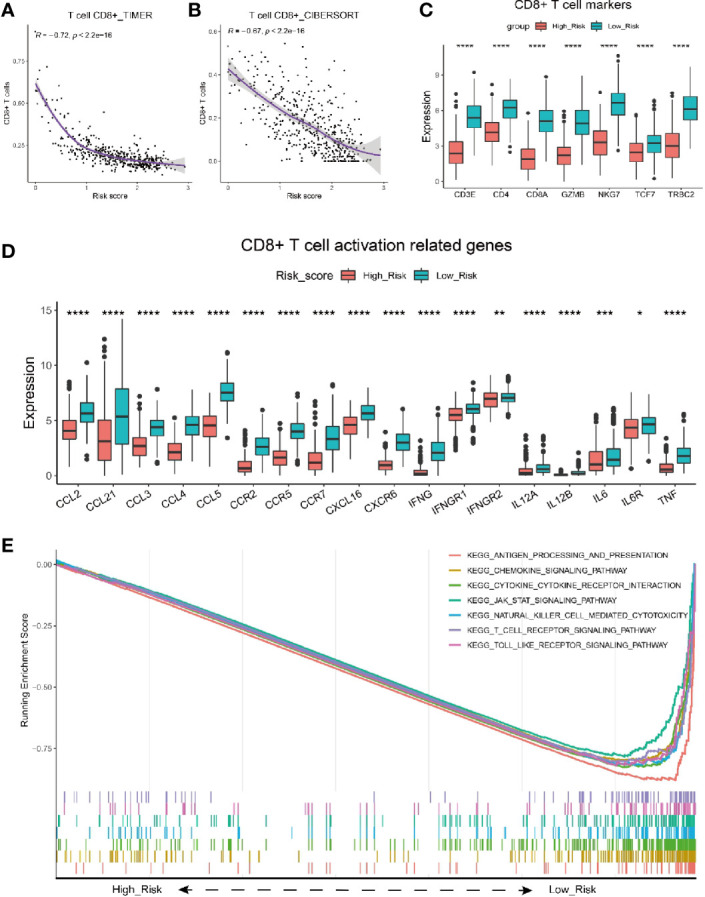
Figure 4.

Characterization of risk score with immune activity. (A, B) Correlation between risk score and the infiltrating number of CD8 T cells in melanoma patients by analysis with TIMER (A) and CIBERSORT (B). (C) Comparison of seven T cell marker expression level between melanoma patients with high and low risk scores in the TCGA cohort. (D) Relationship between risk score and CD8+ T cell activation related genes. Adjusted P values were showed as: *P < 0.05; **P < 0.01; ***P < 0.001, ****P < 0.0001. (E) GSEA of gene expression from data sets TCGA_SKCM shows genes involving in CD8+ T cell infiltration signaling pathway mostly enriched in melanoma patients with low risk scores.
