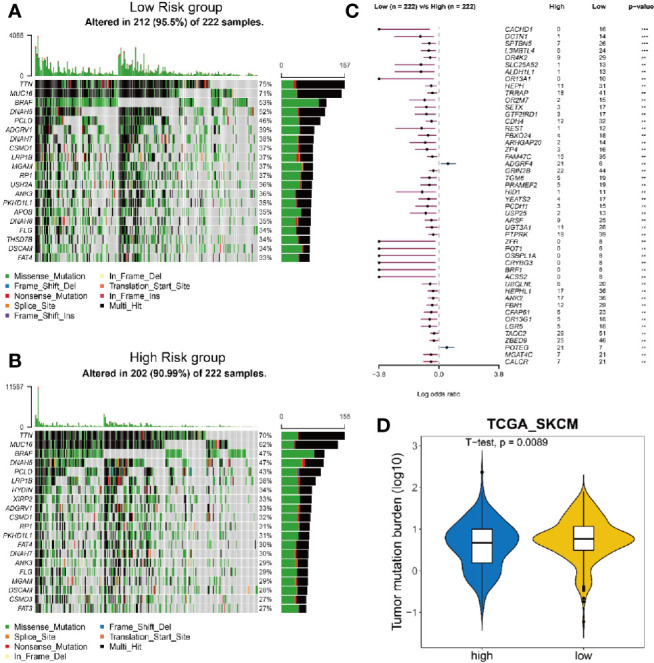
Figure 5.

Analysis of mutation burden in high and low risk group. (A, B) Mutation landscape of 222 melanoma tumor samples with low risk (A) and high risk (B). Central matrix shows somatic mutations with colors indicating different types of mutations and genes mutated at high frequency are represented in the left list. The top bar plot shows the number of gene mutations in each sample and the mutation rate of significantly mutated genes is displayed on the right. (C) Comparison of mutation frequency between high risk group and low risk group. (D) Comparison of tumor mutation burden between high risk group and low risk group.
