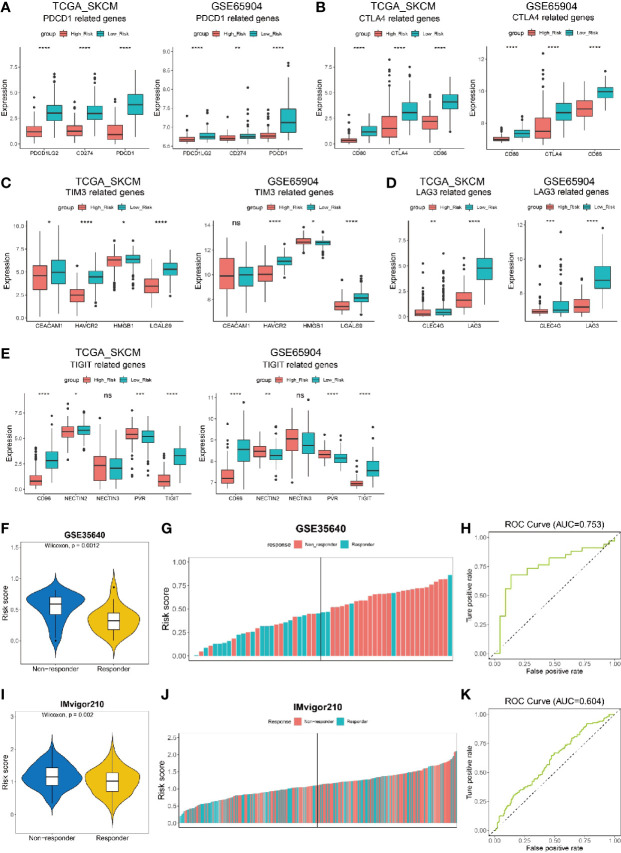
Figure 7.
Risk score to predict the efficacy of immunotherapy on cancer patients. (A–E) Expression of immunotherapy targeted-genes in low risk and high risk melanoma patients from datasets TCGA_SKCM and GSE65904. (A) PDCD1-related genes. (B) CTLA4-related genes. (C) TIM3-related genes. (D) LAG3-related genes. (E) TIGIT-related genes. (F, G) Melanoma patients from data set GSE35640 who received immunotherapy but have no response (non-responder) show higher risk scores than those responders. (K) ROC curve showing the performance of our model for predicting the efficacy of immunotherapy on urothelial cancer patients in data set IMvigor210 at all classification thresholds (AUC=0.604) at all classification thresholds (AUC=0.753). (I, J) Non-responding urothelial cancer patients from data set IMvigor210 show higher risk scores than those responders. (H) ROC curve showing the performance of our model for predicting the efficacy of immunotherapy on urothelial cancer patients in data set IMvigor210at all classification thresholds (AUC=0.604). ns, not significant; *P < 0.05; **P < 0.01; ***P < 0.001; ****P < 0.0001.

