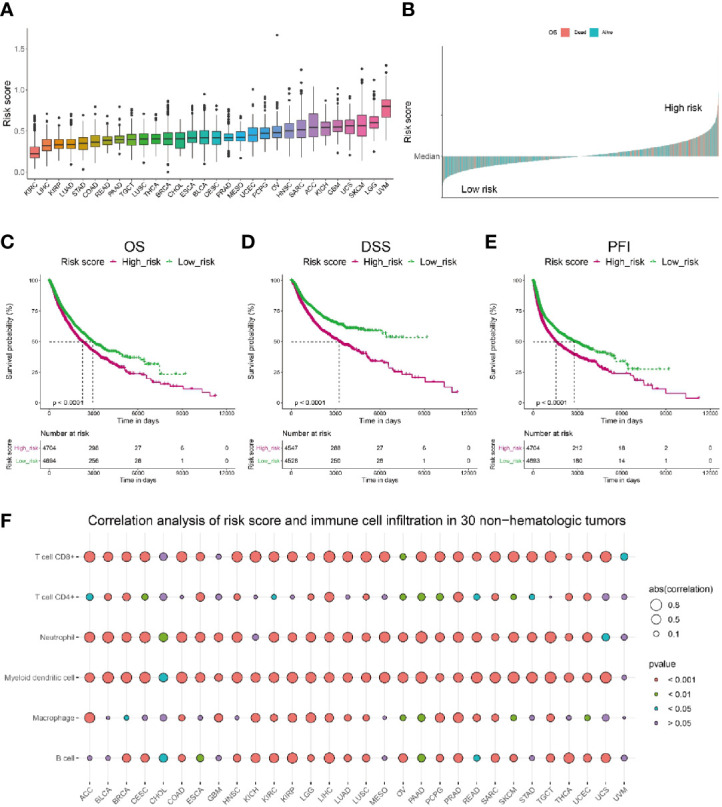
Figure 8.

Pan-cancer analysis of the correlation between risk score and immune cell infiltration as well as patients’ survival. (A) Pan-cancer analysis of risk score in 30 non-hematologic tumors. (B) Pan-cancer analysis of risk score indicated patients with high risk (above median) had higher death rate (shown in pink). (C–E) Pan-cancer analysis showed that patients with lower risk score have significantly longer overall survival (C), longer disease-specific survival (D) and longer disease-free interval (E) than those with higher risk score. (F) Correlation analysis of risk score and immune cell infiltration level in 30 non-hematologic tumors by TIMER.
