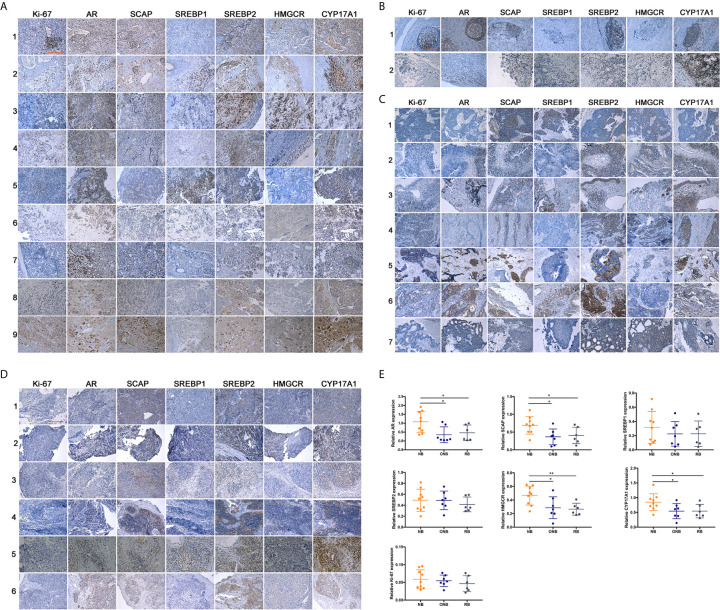
Figure 1.
Expression of related proteins in clinical neuroblastic tumors analyzed by IHC. Images were visualized by inverted microscope. Scale bar = 250 μm. (A) Neuroblastoma samples, n = 9; (B) Ganglioneuroblastoma samples, n = 2; (C) Olfactory neuroblastoma samples, n = 7; (D) Retinoblastoma samples, n = 6; (E) Intensity of immunohistochemical staining was auto-calculated by Image-Pro Plus 6.0 to test positive rate, and quantitative map was plot by GraphPad Prism 7. The data are reported as mean ± SD (*P < 0.05, **P < 0.01).

