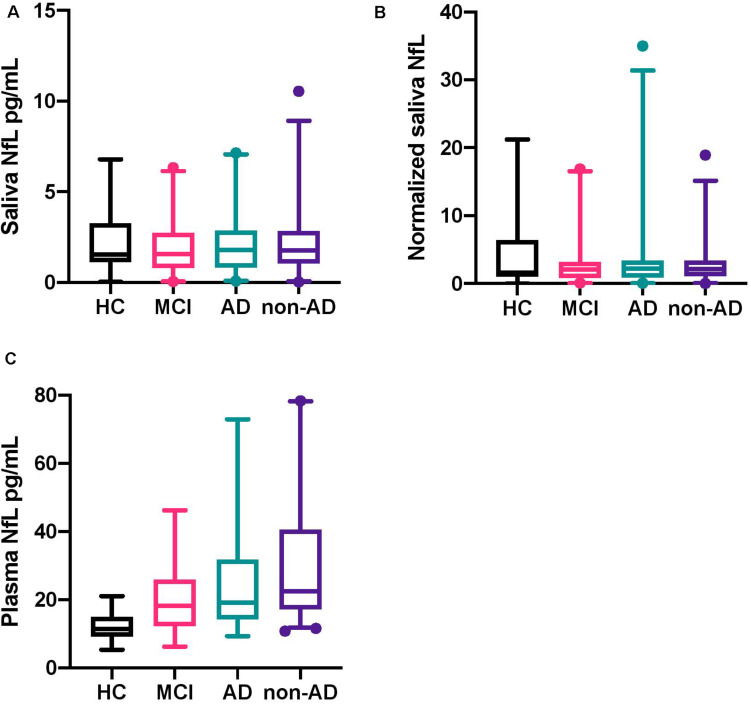
FIGURE 1.
Box plots of neurofilament light chain levels in saliva and plasma and the normalized levels of saliva NfL. (A) The boxplots show the median, interquartile range, and the extreme values of salivary NfL for HC, MCI, AD, and non-AD. The 2.5–97.5 percentile of all data had been included in the boxplots. (B) The boxplots show the median, interquartile range, and the extreme values of the normalized levels of salivary NfL for HC, MCI, AD, and non-AD. The 2.5–97.5 percentile of all data had been included in the boxplots. (C) The boxplots show the median, interquartile range, and the extreme values of plasma NfL for HC, MCI, AD, and non-AD. The 2.5–97.5 percentile of all data had been included in the boxplots. NfL, neurofilament light chain; HC, healthy controls; MCI, mild cognitive impairment; AD, Alzheimer’s disease.

