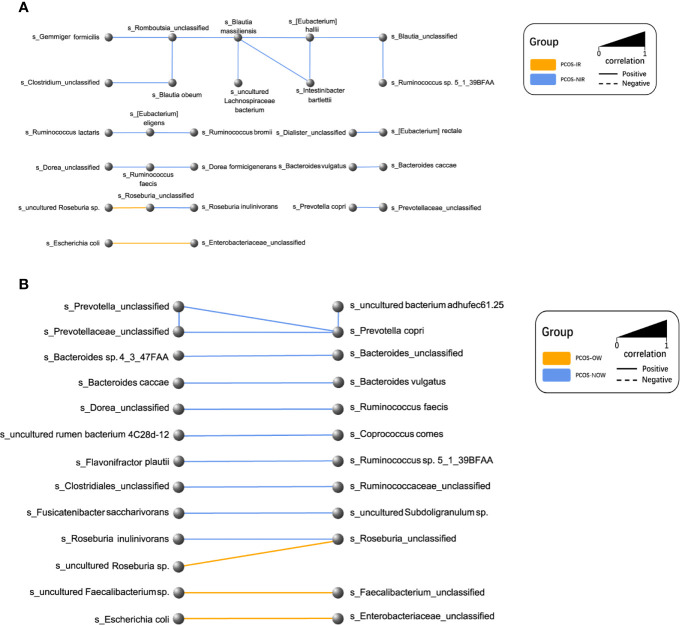
Figure 7.
Network plot of species. Every node represented a species. Two species that had a positive relationship were connected with a solid line, and a negative relationship with a dashed line. The width of the line represented the strength of association. (A) Relationships between PCOS-IR and PCOS-NIR. (B) Relationships between PCOSOW and PCOS-NOW.

