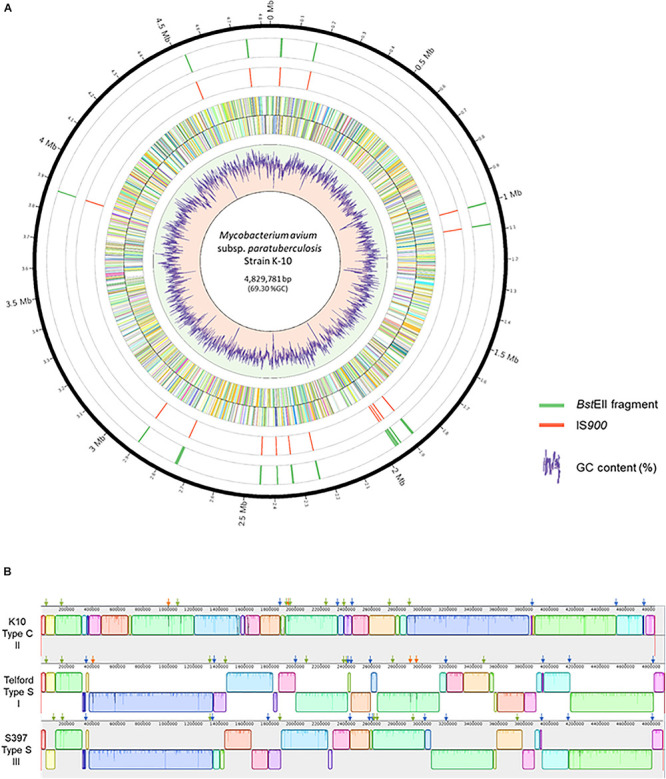
FIGURE 2.

Distribution of IS900 copies on the genome of Mycobacterium avium subsp. paratuberculosis strain K-10. (A) Shown, using Circos version 0.69–8, from the outer circle to the inner circle are the megabase (Mb) positions on the chromosome, the BstEII restriction sites, the position of each IS900 element, plus strand ORFs, minus strand ORFs and a plot of the percent GC. (B) Mauve alignment of K-10 (top) with Telford (middle) and S397 (bottom) showing genomic reorganization of the genomes. The colored boxes represent homologous regions present in each genome. Blocks below the centerline indicate regions with inverse orientation. Regions outside the blocks lack homology between the genomes. Within each block there is a similarity profile of the DNA sequences and the white areas indicate sequences specific to a genome. The scale is in base pairs. Orthologous insertions are indicated, using the slider of Mauve, by a green arrow, specific insertions are indicated by a orange arrow and conserved loci only in two genomes by a blue arrow.
