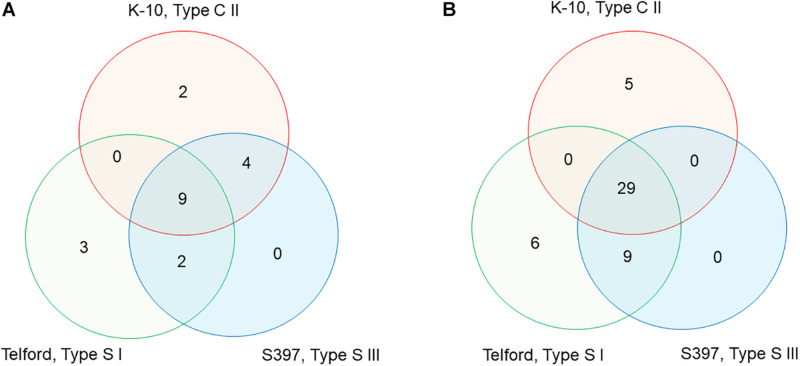
FIGURE 5.
Venn diagram, showing IS900 orthologous sites and orthologous loci between the three Map genomes. (A) The diagram indicates the number of IS900 sites unique or orthologous between 2 and 3 genomes. (B) The diagram indicates the number of orthologous or unique loci upstream and downstream of the IS900 between genomes. Refer to Supplementary Table 2 for additional details.

