Figure 5.
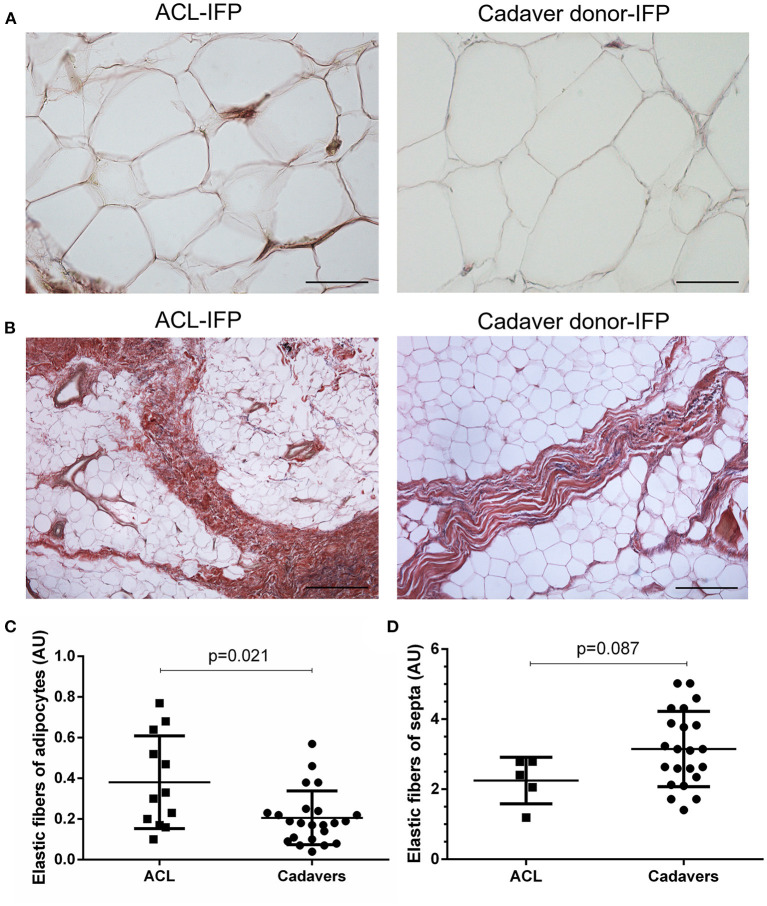
Elastic fibers distribution. Van Gieson staining showed in violet the elastic fibers orientation around the adipocytes (A) (scale bar = 200 μm) and in correspondence of the septa (B) (scale bar = 50 μm) for ACL-IFPs and cadaver donors-IFPs. Quantification of the elastic fibers showed differences in the two settings. Significantly, higher elastic fibers were observed around the adipocytes in the ACL-IFPs (p = 0.021) (C) but not in correspondence of the septa in the cadaver donors-IFPs (p = 0.0872) (D). For the adipocytes surrounding areas, data analysis considered n = 12 and n = 23 tissue samples for ACL-IFPs and cadaver donors-IFPs, respectively; for the septa, data analysis considered n = 5 and n = 23 tissue samples for ACL-IFPs and cadaver donors-IFPs, respectively. AU, arbitrary unit.

