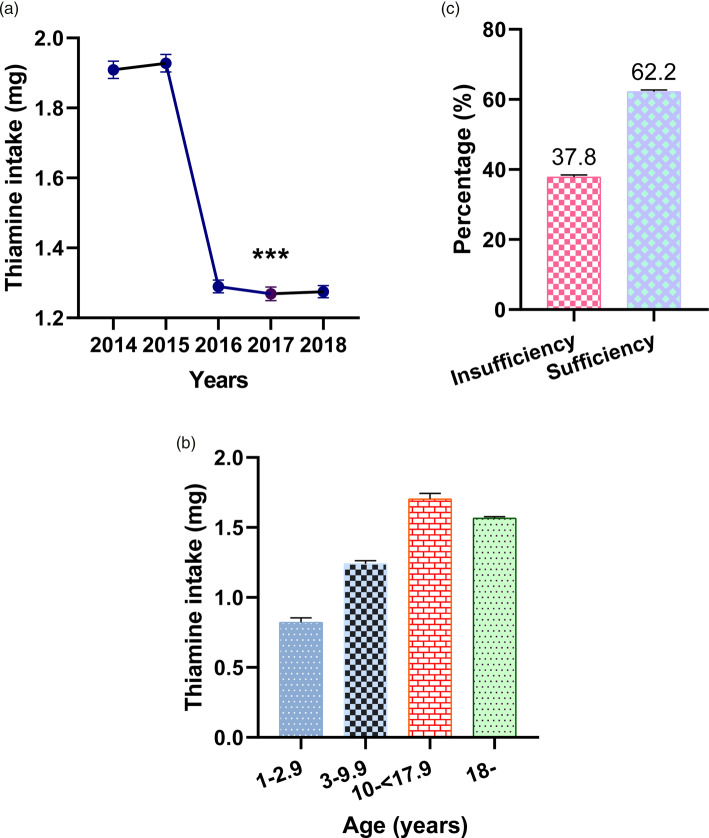
Fig. 1.
Levels of thiamine intake by year and age group (a and b), and the percentage of insufficient and sufficient thiamine intake among the Korean population (c). ***P < 0⋅001, levels of thiamine intake in each year from 2016 to 2018 compared with 2014 and 2015, one-way ANOVA, Bonferroni. Error bars represent 95 % CIs.

