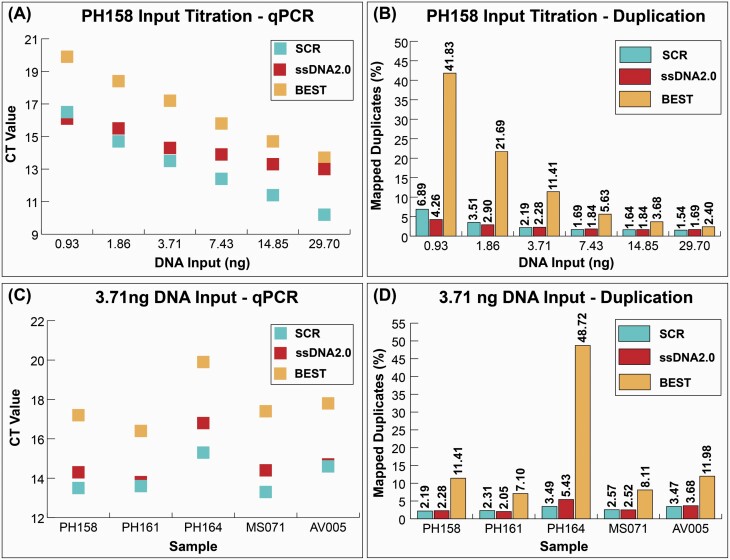
Figure 2.
Library preparation complexity comparison. (A) Quantitative PCR CT values for libraries prepared from sample PH158 using a titration of 6 DNA inputs ranging from 0.93 ng to 29.70 ng. Lower CT values indicate more starting library molecules in the reaction (B) Proportion of mapped reads that are duplicates prepared from sample PH158 at the different titrations of DNA input. (C) Quantitative PCR CT values for libraries prepared from 5 ancient DNA extracts using a static DNA input of 3.71 ng. (D) Proportion of duplicated reads from libraries prepared from these 5 ancient DNA extracts using the static 3.71 ng DNA input.

