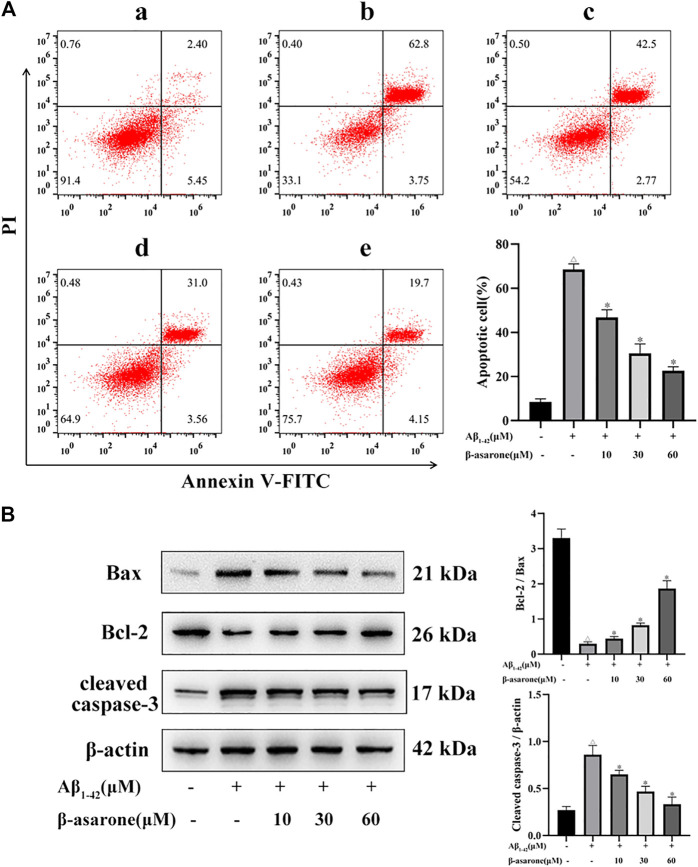
FIGURE 2.
Effect of β-asarone on apoptosis in PC12 cells. (A) Apoptosis was measured by flow cytometry, and the percentage of early and late apoptotic cells was quantified. The left lower quadrant represents the normal cells, the right lower quadrant represents the early apoptosis cells, the right upper quadrant represents the late apoptosis cells, and the left upper quadrant represents the death cells. a, Control group; b, Aβ1–42-alone treatment group; c, Aβ1–42+β-asarone (10 μM) group; d, Aβ1–42+β-asarone (30 μM) group; e, Aβ1–42+β-asarone (60 μM) group. (B) Expression levels and quantification of Bcl-2/Bax and cleaved caspase-3 were examined by Western blot. △ p < 0.05 compared with the control group; * p < 0.05 compared with the Aβ1–42-alone treatment group. The data were expressed as mean ± SD of three independent experiments, each in triplicate.

