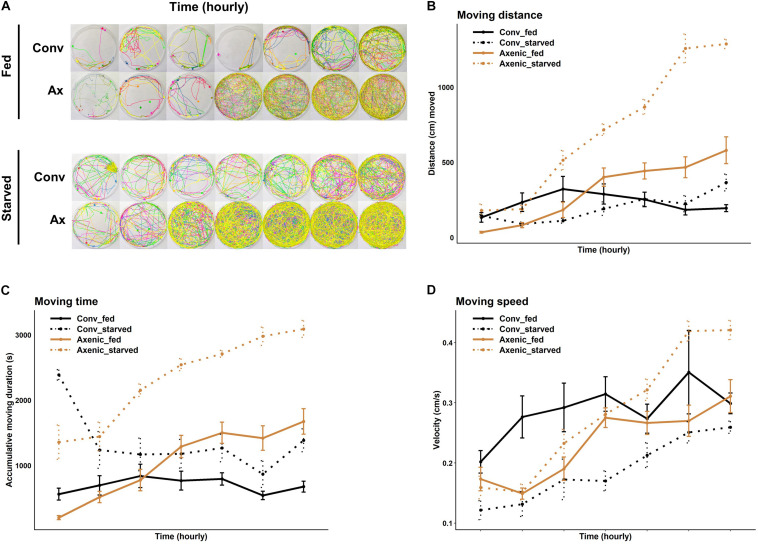
FIGURE 2.
Effects of the microbiome on locomotor activities of fed or starved female Drosophila suzukii. (A) Movement profiles of groups of eight conventional (Conv) and axenic (Ax) flies in the locomotion assay at 1 h intervals. (B) Hourly moving distance, (C) moving time, and (D) moving speed of fed or starved conventional flies (black lines) and axenic flies (golden lines) during the 7 h. (B–D) Fed conventional flies, n = 16; starved conventional flies, n = 16; fed axenic flies, n = 16; starved axenic flies, n = 16. n indicates the number of flies tracked. The error bars represent the means ± SEM (standard error of the means). All pairwise comparisons were analyzed with two-sample t-tests after meeting the normality assumption with Shapiro–Wilk test. Full statistical details are in Supplementary Table 2.

