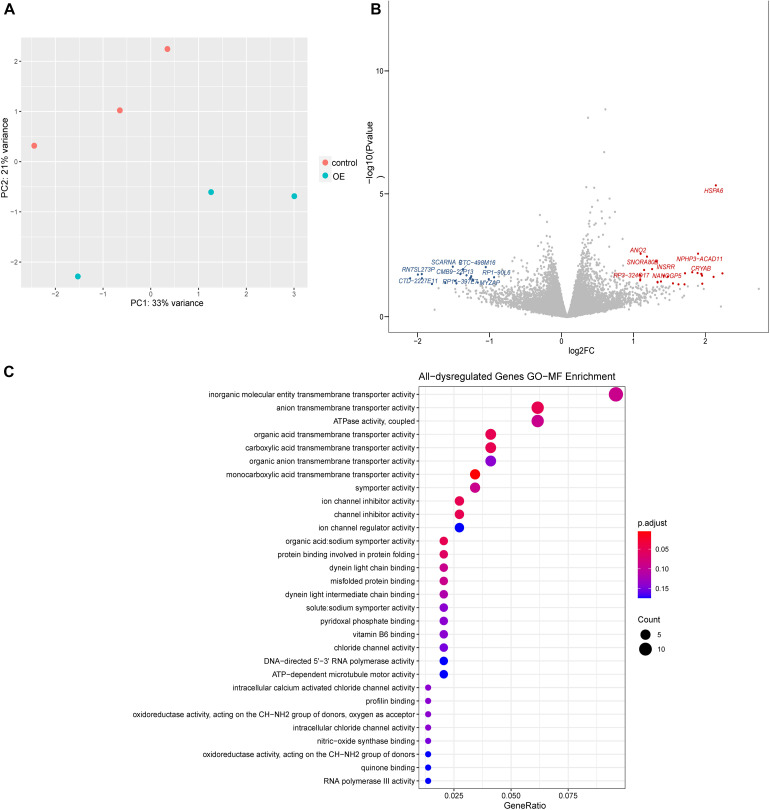
FIGURE 3.
Differential gene expression analysis of lnc-TSSK2-8 overexpression in HEK293 cells. (A) Principal component analysis of RNAseq data derived from lnc-TSSK2-8 overexpression and control cell samples. (B) Volcano plot of differential gene expression analysis; symbols of the top 15 for each of upregulated and downregulated genes were labeled. (C) Gene Ontology (GO) gene set functional enrichment analysis of DEGs.

