Fig. 1.

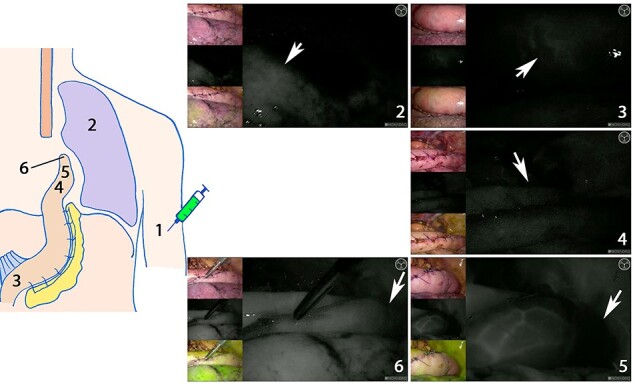
Time to fluorescent enhancement: time points measured. (1) Time of indocyanine green injection. Time of first fluorescent enhancement: (2) in the right lung; white arrow points at fluorescence in the lung. (3) At the base of the gastric conduit; white arrow points at the first signal. (4) At the planned anastomotic site; white arrow points at the planned anastomotic site. (5) At the ICG watershed; white arrow points at the tip that is not fluorescently enhanced. (6) In the tip of the gastric conduit; white arrow points at a well-perfused tip. Images (2)–(6) were derived by the laparoscopic system. For each image, visual assessment is shown on the upper left, near infrared fluorescence in white in the middle left and the larger image on the right, and merge between the two images with the fluorescent signal in pseudo-green in the lower left. Images (2)–(5) display time assessment in one patient. Image 6 is from another patient with fluorescent enhancement in the tip of the gastric conduit.
