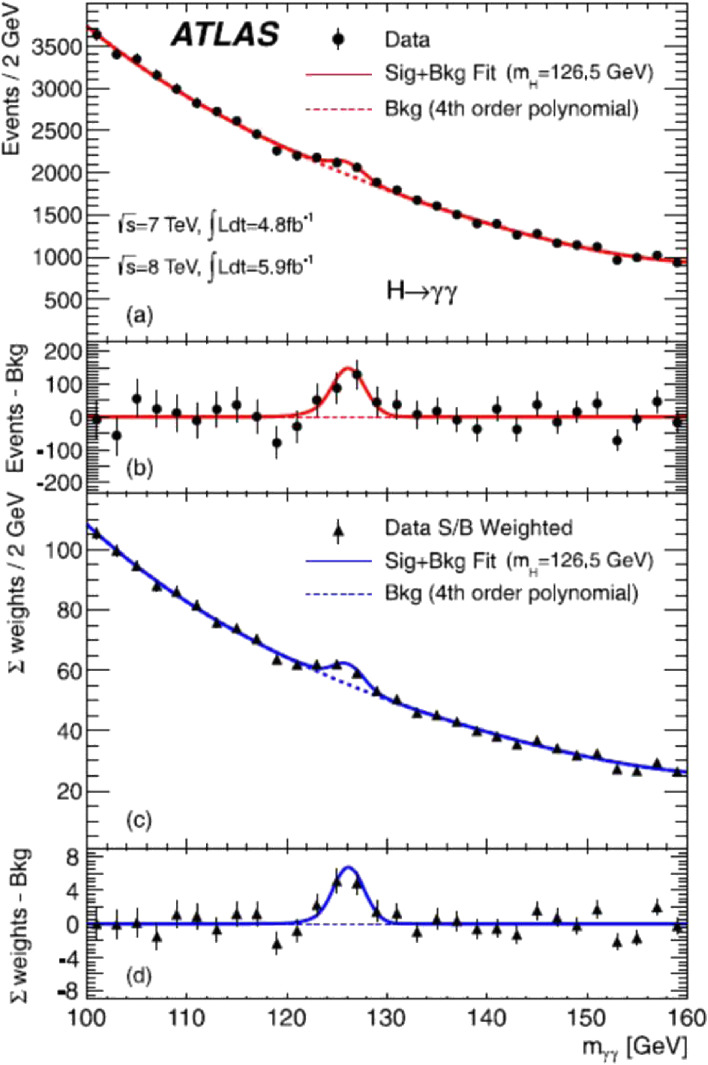
Figure 18.
(Color online) Distributions of the diphoton invariant mass measured by the ATLAS experiment. The inclusive sample is shown in (a) and a weighted version of the same sample in (c). The results of a fit to the data with a signal component fixed to mH = 126.5 GeV and a background component described by a fourth-order polynomial is superimposed. The residual of the data and weighted data with respect to the respective fitted background component are displayed in (b) and (d).

