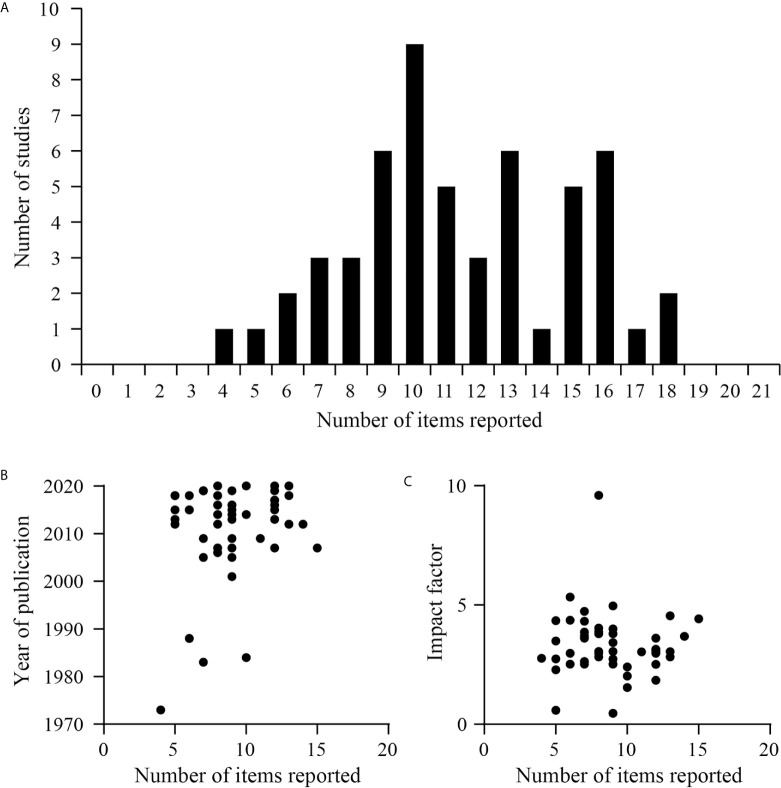
Figure 5.
Studies distribution and correlation of the reported items. (A) Histogram representing the distribution of studies according to the items reported by them. (B) Correlation between the number of items reported by each study and the year of publication of the study in the journal (p=0.28, r=0.15, Pearson’s correlation coefficient r). (C) Correlation between the journal’s impact factor (2019) and the number of items reported by each study (p=0.69, r=-0.05, Pearson’s correlation coefficient r).

