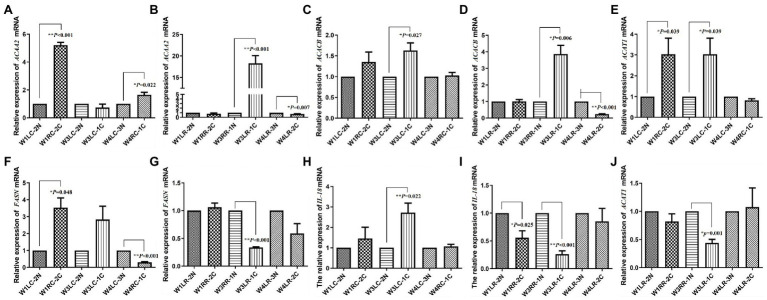
Figure 3.
Validation of transcript expression by quantitative PCR (qPCR). (A,B) The expression of ACAA2 mRNA in tree shrew choroid and retina, respectively; (C,D) The expression of ACACB mRNA in tree shrew choroid and retina, respectively; (E,J) The expression of ACAT1 mRNA in tree shrew choroid and retina, respectively; (F,G) The expression of FASN mRNA in tree shrew choroid and retina, respectively; (H,I) The expression of IL18 mRNA in tree shrew choroid and retina, respectively. Data are presented as mean ± SEM (n = 3). GAPDH was used as a housekeeping internal control. Transcript expression was quantified relative to the expression level of GAPDH by 2-ΔΔCT method. 0.001 ≤ *p < 0.05; **p < 0.001.

