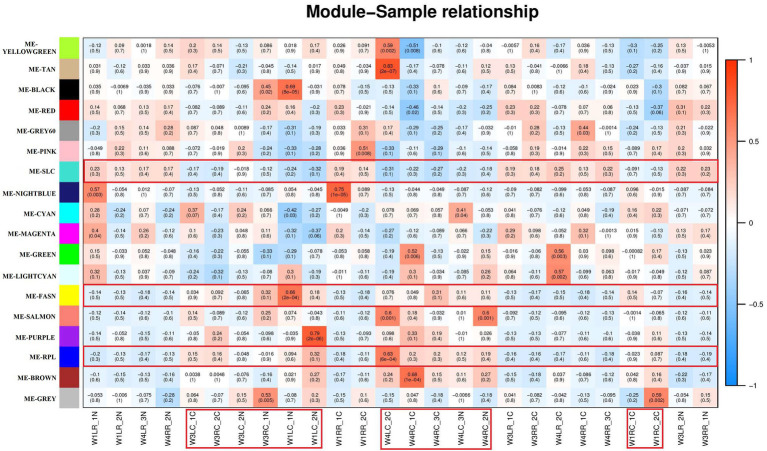
Figure 6.
Module – Sample relationships. The abscissa is the sample and the ordinate is the module. The numbers represent correlation between the module and the sample. Closer the value is to 1, stronger the positive correlation between the module and the sample; closer to −1, stronger the negative correlation. The number in brackets represents value of p, smaller the value, and higher the significance. The red specimen is choroid of the tree shrews.

