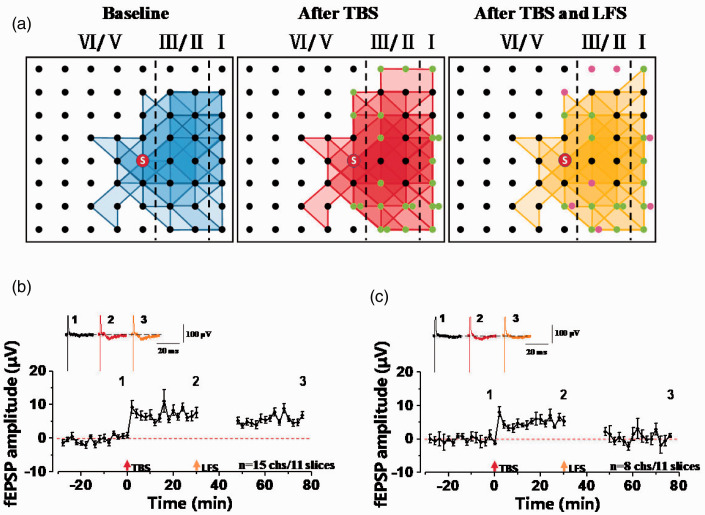
Figure 3.
The network propagation of synaptic responses after TBS and LFS stimulation in the ACC. (a) Basal activated areas (blue), recruited areas (red) induced by TBS, and silent areas (yellow) induced by LFS in male mice, respectively. The recruited channels are shown as green dots and the silent channels are shown as purple dots. (b) Time-varying fEPSP amplitude from 15 recruited channels. These channels (green dots) are recruited by TBS and still exist after LFS. (c) Time-varying fEPSP amplitude from 8 silent channels. These channels (purple dots) are recruited by TBS and are silenced after LFS.

