
Figure 1.
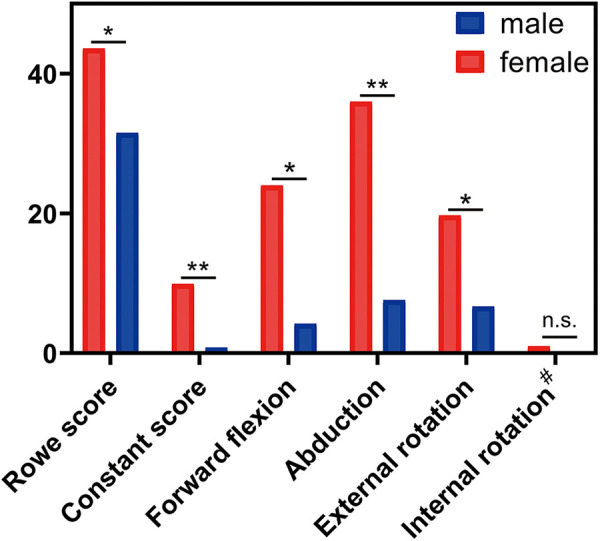
Mean pre- to postoperative changes in outcomes between the sexes. *P < .05; **P < .01; n.s., not significant. #Absolute values were used in place of negative numbers.
Official websites use .gov
A
.gov website belongs to an official
government organization in the United States.
Secure .gov websites use HTTPS
A lock (
) or https:// means you've safely
connected to the .gov website. Share sensitive
information only on official, secure websites.
Mean pre- to postoperative changes in outcomes between the sexes. *P < .05; **P < .01; n.s., not significant. #Absolute values were used in place of negative numbers.