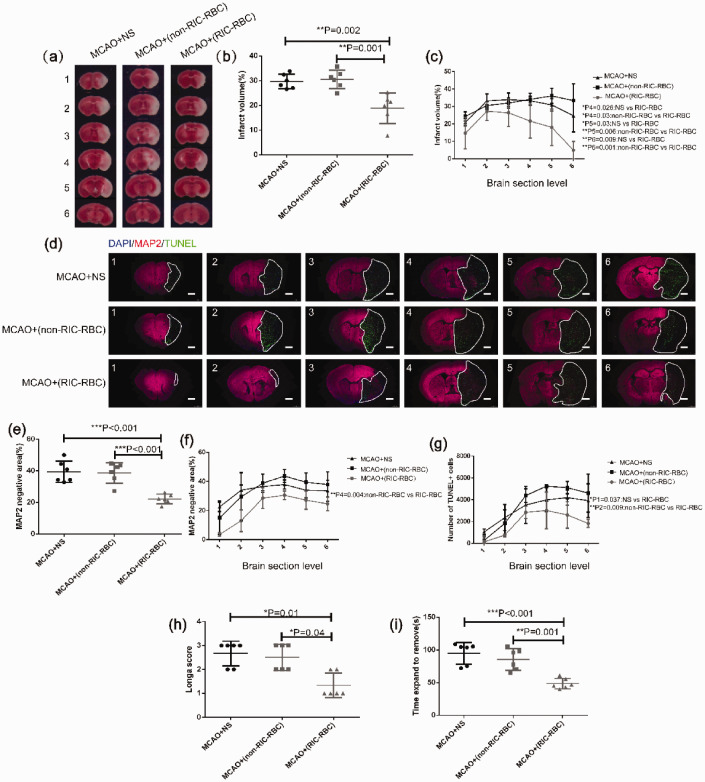
Figure 6.
Transfusion of 2,3-BPG-rich RBCs prepared from RIC-treated donor mice alleviates infarct size and apoptosis of brain cells, and improves behavioral function in MCAO mice. (a) Representative TTC staining images of different sections of brain tissue from one mouse in each group as indicated (6 mice per group). The numbers 1 to 6 represented coronal sections at different planes of mouse brain. The brain tissue with pale TTC staining was the infarct region. (b) The average total infarct volume (%) evaluated by TTC staining of six sections in the different groups was compared by one-way ANOVA followed by the post hoc test. (c) Infarct volume (%) by TTC staining of individual sections compared by one-way ANOVA followed by the post hoc test. P1–P6 represent the p values when the six individual sections were compared as indicated in the figure (only showing the sections with a significant difference). (d) Representative images of different sections of brain tissue MAP2 and TUNEL immunofluorescent staining were shown (scale bar 1 mm) in each group as indicated (6 mice per group). The numbers of 1 to 6 represented six coronal sections at different planes of mouse brain with 1 mm apart between two adjacent sections. The white line marked area was infarct with MAP2 staining negative and TUNEL staining positive. (e) The average total infarct area (%) evaluated by MAP2 immunofluorescent staining of six sections of all mice in different groups was compared by one-way ANOVA followed by post hoc test. (f) Infarct area (%) by MAP2 immunofluorescent staining of different individual sections was compared by one-way ANOVA followed by post hoc test. P1–P6 represent the p values when the six individual sections were compared as indicated in the figure (only showing the sections with a significant difference). (g) Apoptotic cells examined by TUNEL immunofluorescent staining and analyzed as described in the Materials and methods. The total TUNEL+ cells at different sections were compared by one-way ANOVA followed by the post hoc test. P1–P6 represented the p values when the six individual sections were compared as indicated in the figure (only showing the sections with significant difference). (h) Neurological function assessed by the Longa scoring system compared between the different groups by non-parametric test (Kruskal–Wallis test). (i) Delay time in stick strip removal during the adhesive removal test compared between the different groups by one-way ANOVA followed by the post hoc test. *p < 0.05, **p < 0.01. The findings were similar when the same experiment was repeated independently.

