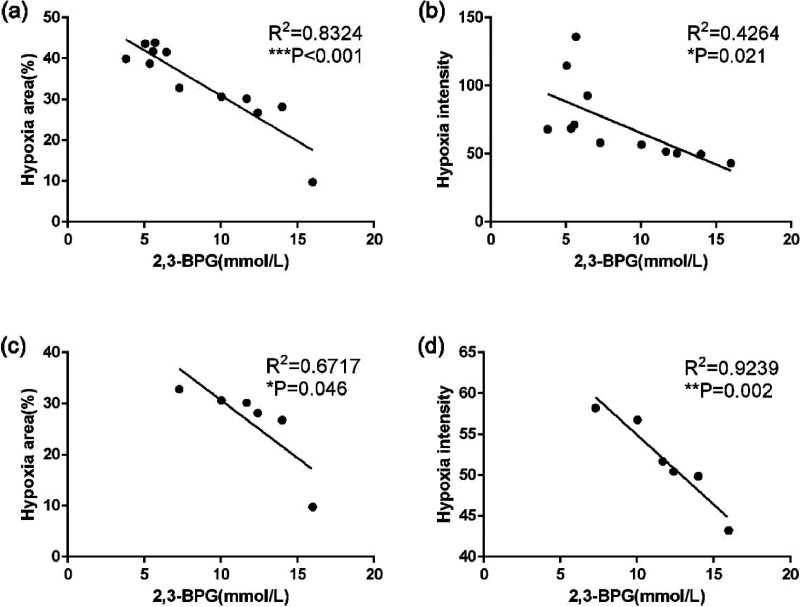
Figure 7.
Relationship between erythrocyte 2,3-BPG levels and ischemic brain tissue oxygen supply impacted by erythrocyte transfusion. Pearson correlation analysis was performed to analyze the relationship between erythrocyte 2,3-BPG levels and hypoxic signals for the data shown in Figure 5. (a) The correlation was shown between 2,3-BPG levels of transfused RBCs and hypoxic areas in the ischemic brain tissues, combining data from RIC-RBCs and non-RIC-RBCs groups. (b) The correlation was shown between 2,3-BPG levels of transfused RBCs and hypoxic signal intensities in the ischemic brain tissues, combining data from RIC-RBCs and non-RIC-RBCs groups. (c) The correlation was shown between 2,3-BPG levels of RIC-RBCs and hypoxic areas in the ischemic brain tissues from the data exclusively from RIC-RBCs group. (d) The correlation was shown between 2,3-BPG levels of RIC-RBCs and hypoxic intensities in the ischemic brain tissues from the data exclusively from RIC-RBCs group. *p < 0.05, **p < 0.01, ***p < 0.001.

