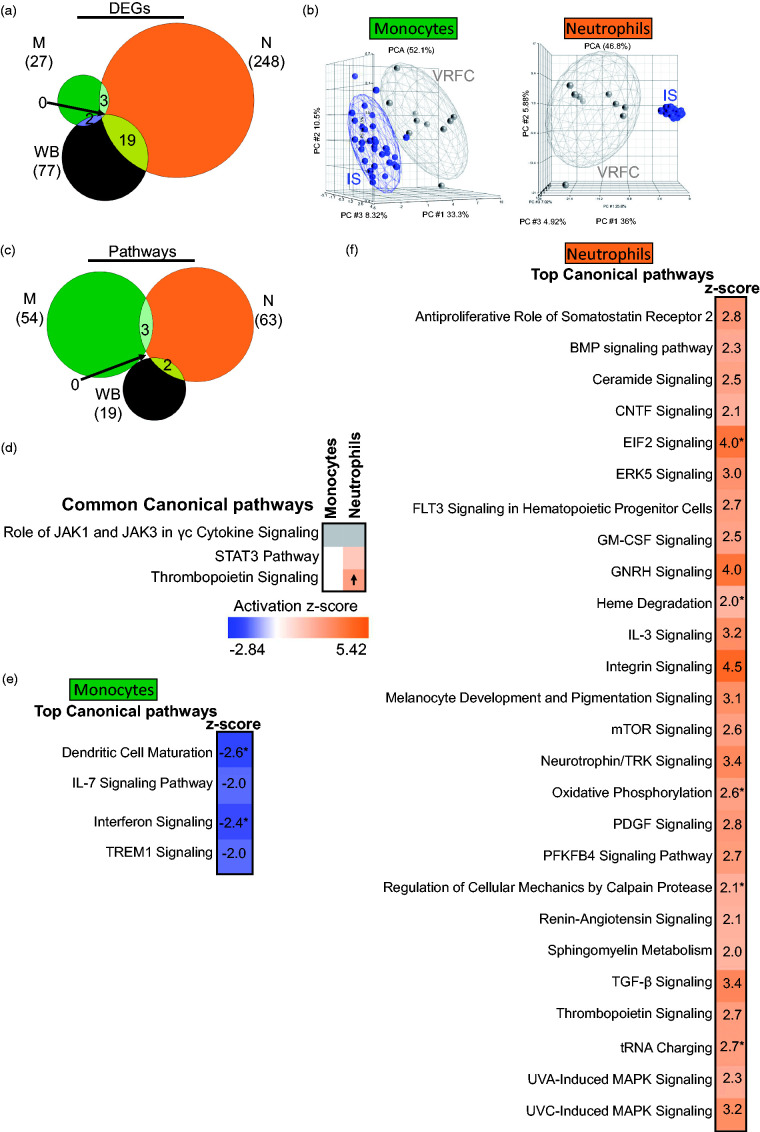
Figure 2.
Molecular signatures for IS versus VRFC in the sample types analyzed. (a) Venn diagram of the numbers of DEGs in monocytes (green), neutrophils (orange), and whole blood (brown); (b) principal component analyses (PCA) using the DEGs in IS-monocytes versus VRFC-monocytes (left PCA) and IS-neutrophils versus VRFC-neutrophils (right PCA), the effects of additional factors were removed before plotting. (c) Venn diagram of the numbers of over-represented significant canonical pathways (p < 0.05) for IS; (d) common pathways in monocytes and neutrophils. Top enriched pathways are shown for monocytes (e) and neutrophils (f). The asterisk depicts significant pathways that passed additional stringency criteria (Benjamini–Hochberg corrected p-value < 0.05). In the plot, orange cells indicate predicted activation of the pathway, blue ones show predicted inhibition, grey cells – no prediction can be performed, and white depicts no direction can be inferred. The shades for every colored cell represent z-scores values. Arrows represent the direction of the change for significant activation (Z ≥ 2 = activation, up arrow); or significant inhibition (Z ≤ −2, down arrow).

