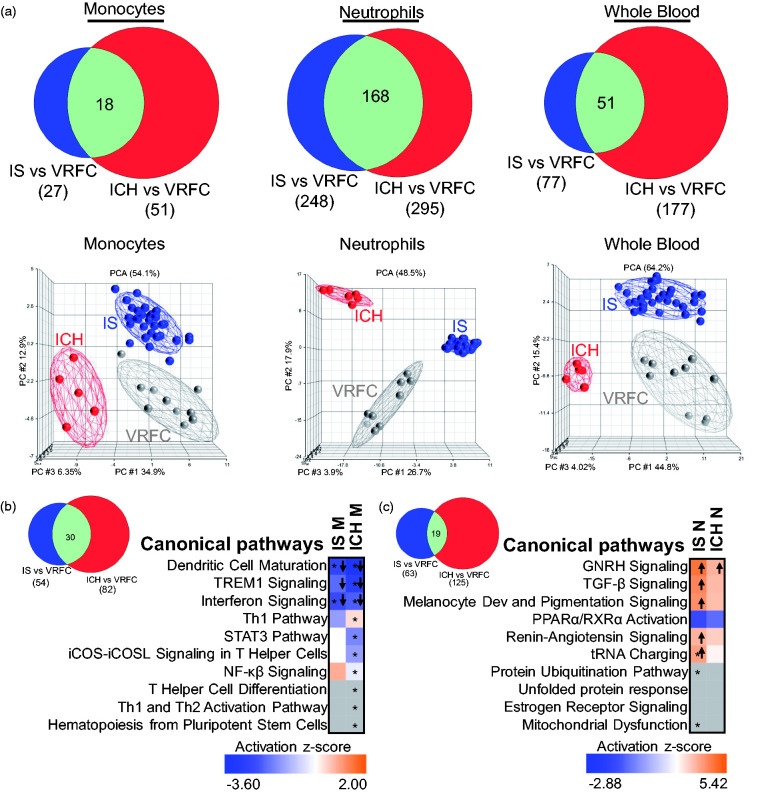
Figure 3.
Comparison of the transcriptional changes in ICH and IS (irrespective of IS-cause). (a) Venn diagrams are shown for the genes found DE in IS and ICH according to the criteria used (FC > |1.2|, p < 0.05 for the individual contrasts and having Sample_Type * Diagnosis FDR (step up) < 0.2), in monocytes, neutrophils, and whole blood. The overlap of DEGs between ICH and IS is significant (hypergeometric test). From all the gene lists included in the Venn diagrams, below are the corresponding PCAs, where grey circles indicate VRFC, red depicts ICH, and blue, IS. Ellipsoids represent two standard deviations from the centroid. Top 10 canonical pathways for IS and ICH (Fisher’s p-value < 0.05) in (b) monocytes and (c) neutrophils are presented. The asterisk depicts pathways with Benjamini–Hochberg corrected p-value < 0.05. In the plot, orange cells indicate predicted activation of the pathway, blue ones show predicted inhibition, white cells – no direction can be predicted, and grey depicts no prediction can be performed. The shades for every colored cell represent z-scores values. Arrows indicate predicted significant activation (Z ≥ 2, up arrow) or significant inhibition (Z ≤ −2, down arrow) of the pathway. Melanocyte development and pigmentation signaling is abbreviated. The Venn diagrams next to the heatmaps represent the number of pathways with p-value < 0.05 for both diagnoses in monocytes (b) and neutrophils (c).

