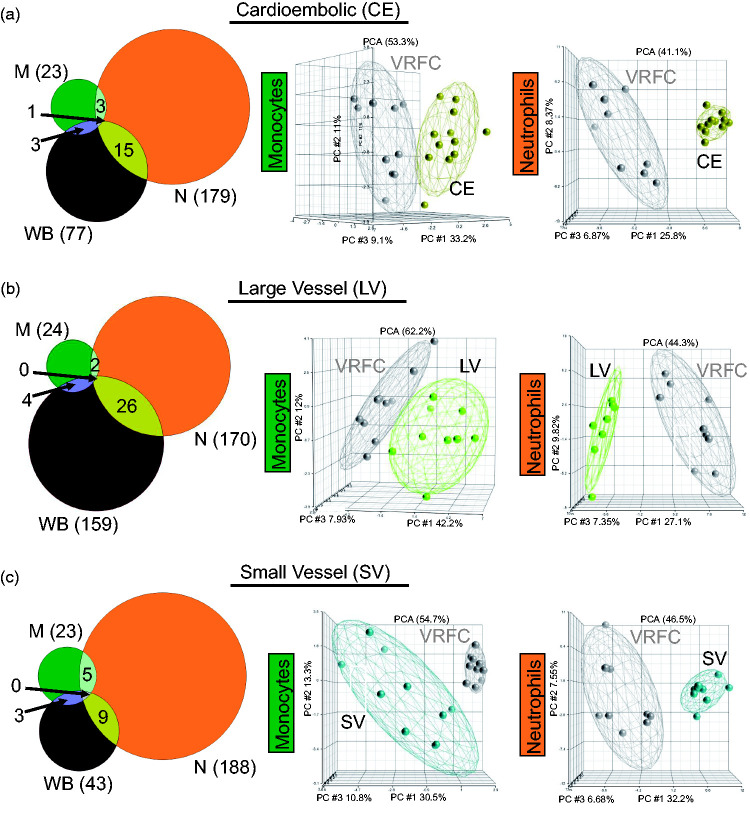
Figure 4.
Comparison of the transcriptional changes in IS in the sample types analyzed in monocytes (green), neutrophils (orange), and whole blood (brown) considering IS cause. Venn diagrams and principal component analyses are shown for all the DEGs (fold change ±1.2 plus overlap of FDR (step up) < 0.2, with p-value < 0.05 for the ANOVA interactions assessed against VRFC: (a) CE stroke, (b) LV stroke, and (c) SV stroke). Ellipsoids represent two standard deviations from the centroid.

