Figure 2.
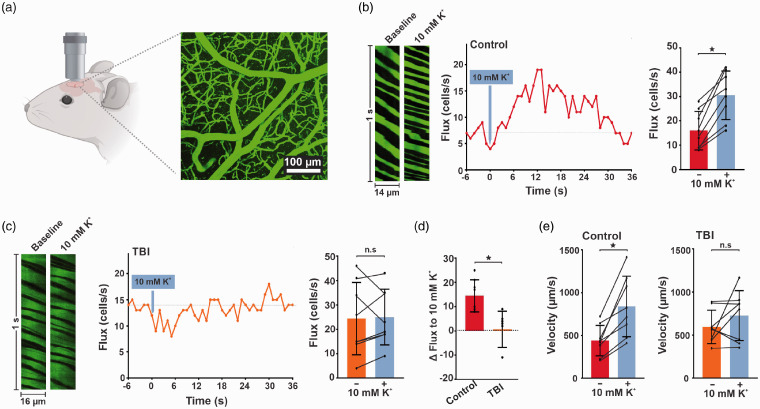
K+-induced hyperemia is impaired in vivo in TBI mice. (a) In vivo imaging approach. A cranial window was prepared over the somatosensory cortex and imaged using 2-photon laser-scanning microscopy. (b and c) Left: baseline and peak distance–time plots of capillary line scans showing hyperemia to the ejection of 10 mM K+ onto a capillary. RBCs passing through the line-scanned capillary appear as black shadows against green fluorescent plasma. Middle: typical experimental time-course of RBC flux binned at 1-s intervals before and after pressure ejection of 10 mM K+ (300 ms, 5 ± 1 psi; gray arrow) onto a capillary, demonstrating hyperemia to K+ delivery. Right: summary RBC flux responses to 10 mM K+ in (b) control and (c) TBI mice. K+ delivery caused significant hyperemia in control (16 ± 8 vs 31 ± 10 cells/s, n = 8 paired experiments, 6 mice; *p = 0.0004, paired t test), but not in TBI (24 ± 15 vs 25 ± 11 cells/s, n = 8 paired experiments, 6 mice; p = 0.819, paired t test) mice when compared to their baseline prior to K+ application, respectively. (d) The percent change in RBC flux after 10 mM K+ application is significantly decreased in TBI mice when compared to controls (0.6 ± 7 vs 15 ± 7%, n = 8; *p = 0.0008, Mann-Whitney test). (e) K+-induced hyperemia caused a significant increase in flux velocity in control (left) (441 ± 179 vs 840 ± 353 µm/s, n = 8 paired experiments, 6 mice; *p = 0.0022, paired t test) but not in (right) TBI (594 ± 195 vs 726 ± 289 µm/s, n = 8 paired experiments, 6 mice; n.s., paired t test) mice when compared to their respective baseline controls. Data are expressed as mean ± SD.

