
Figure 4. Analysis of the different α-synuclein aggregates using transmission electron microscopy (TEM).
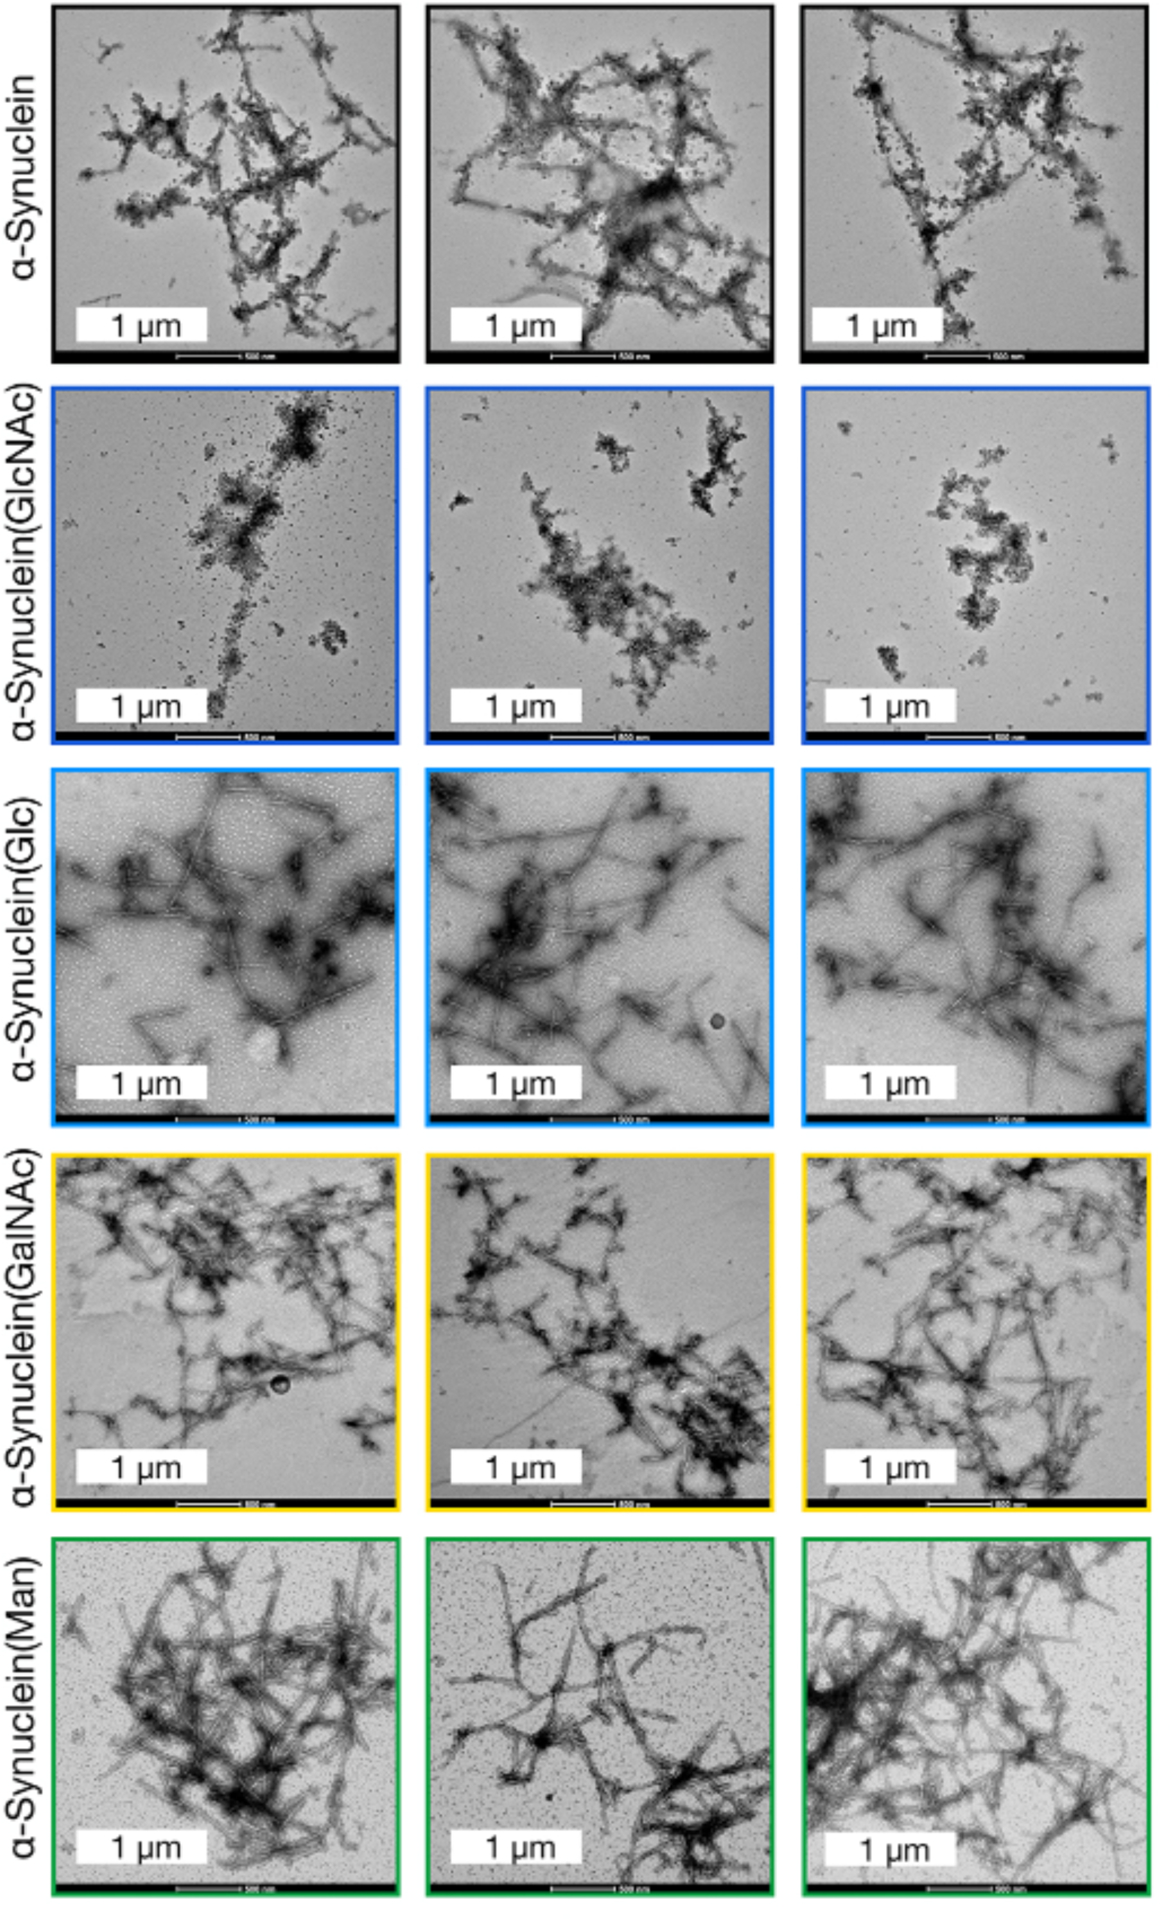
The 192 h timepoint of the aggregation reactions in Figure S10 were visualized using TEM.
Official websites use .gov
A
.gov website belongs to an official
government organization in the United States.
Secure .gov websites use HTTPS
A lock (
) or https:// means you've safely
connected to the .gov website. Share sensitive
information only on official, secure websites.
The 192 h timepoint of the aggregation reactions in Figure S10 were visualized using TEM.