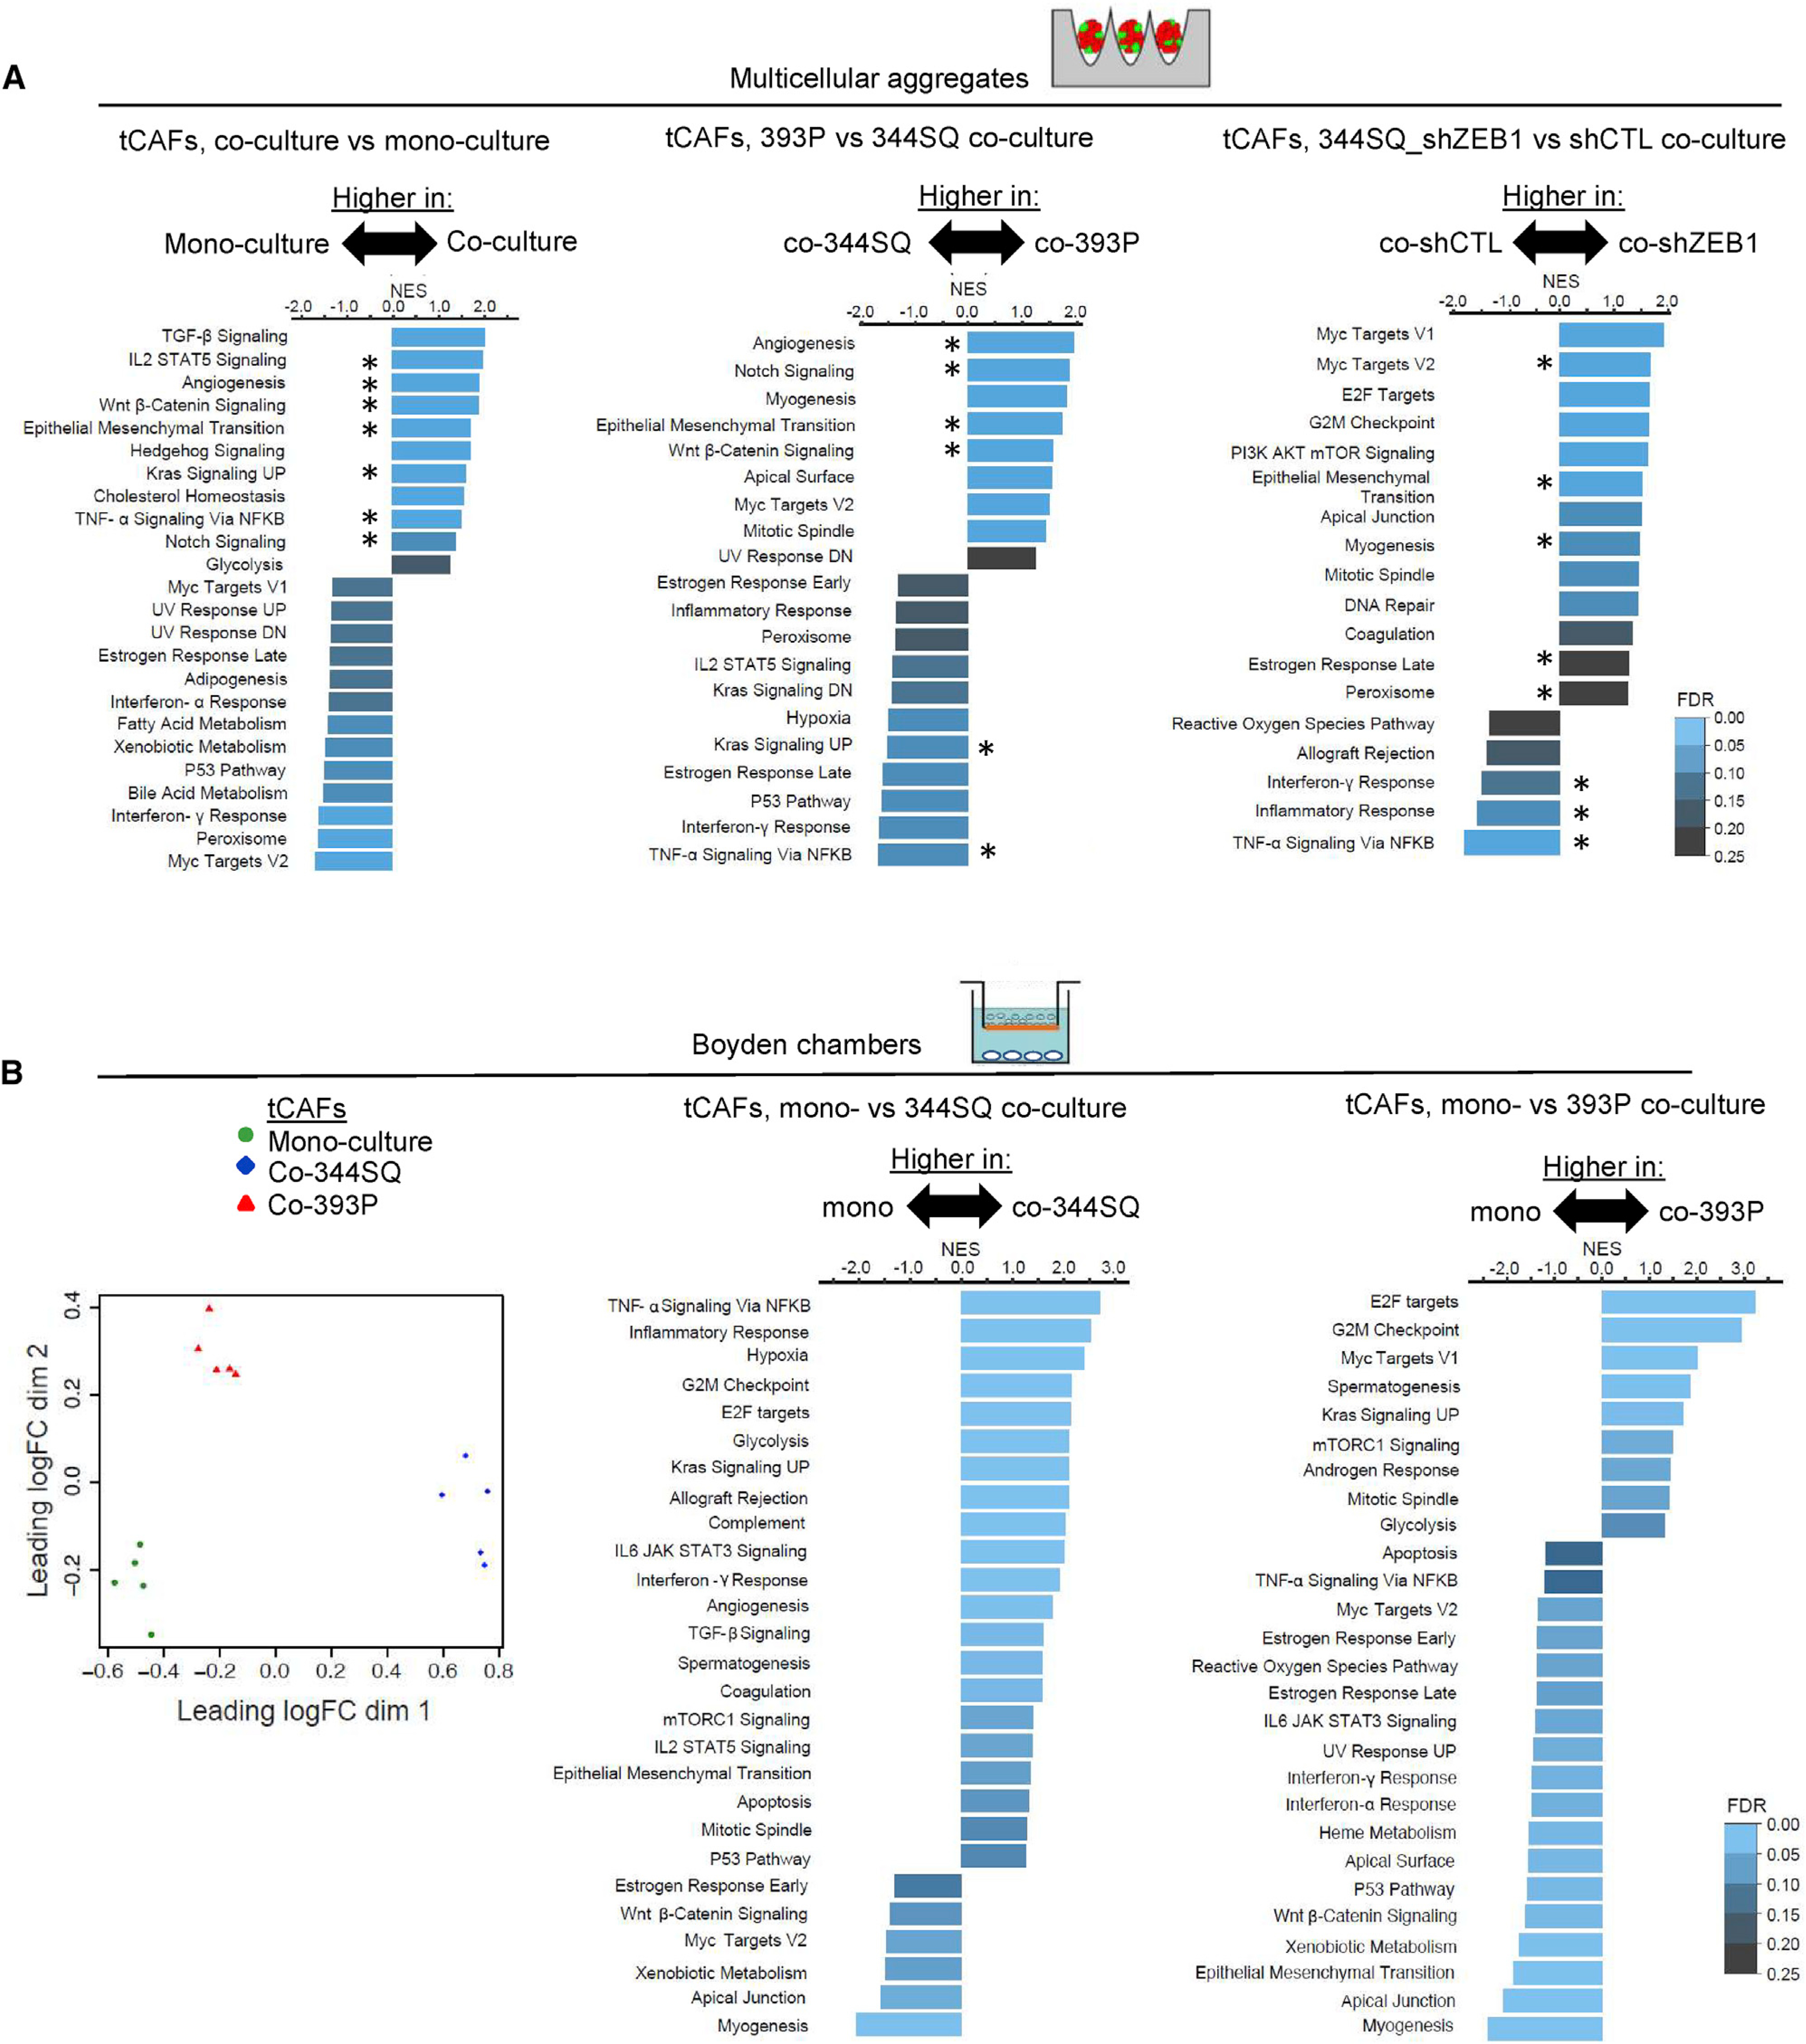
Figure 2. LUAD cells at either end of the EMT spectrum shape tCAF heterogeneity.

(A) GSEA of upregulated genes in tCAFs that were mono- or co-cultured (left), co-cultured with 344SQ cells or 393P cells (center), or co-cultured with ZEB1-deficient (shZEB1) or ZEB1-replete (control shRNA [shCTL]) 344SQ cells (right) in multicellular aggregates. NES represented by bar length. FDR values color-coded. Hallmarks shared between co-cultures are indicated (asterisks).
(B) PCA plot of tCAFs from Boyden chamber preparations (dots) subjected to bulk-cell RNA sequencing. GSEA of upregulated genes in tCAFs that were mono-cultured (mono-) or co-cultured (co-) with 393P cells or 344SQ cells in Boyden chambers. NES represented by bar length. FDR values color-coded. n = 5 biological replicates per condition.
