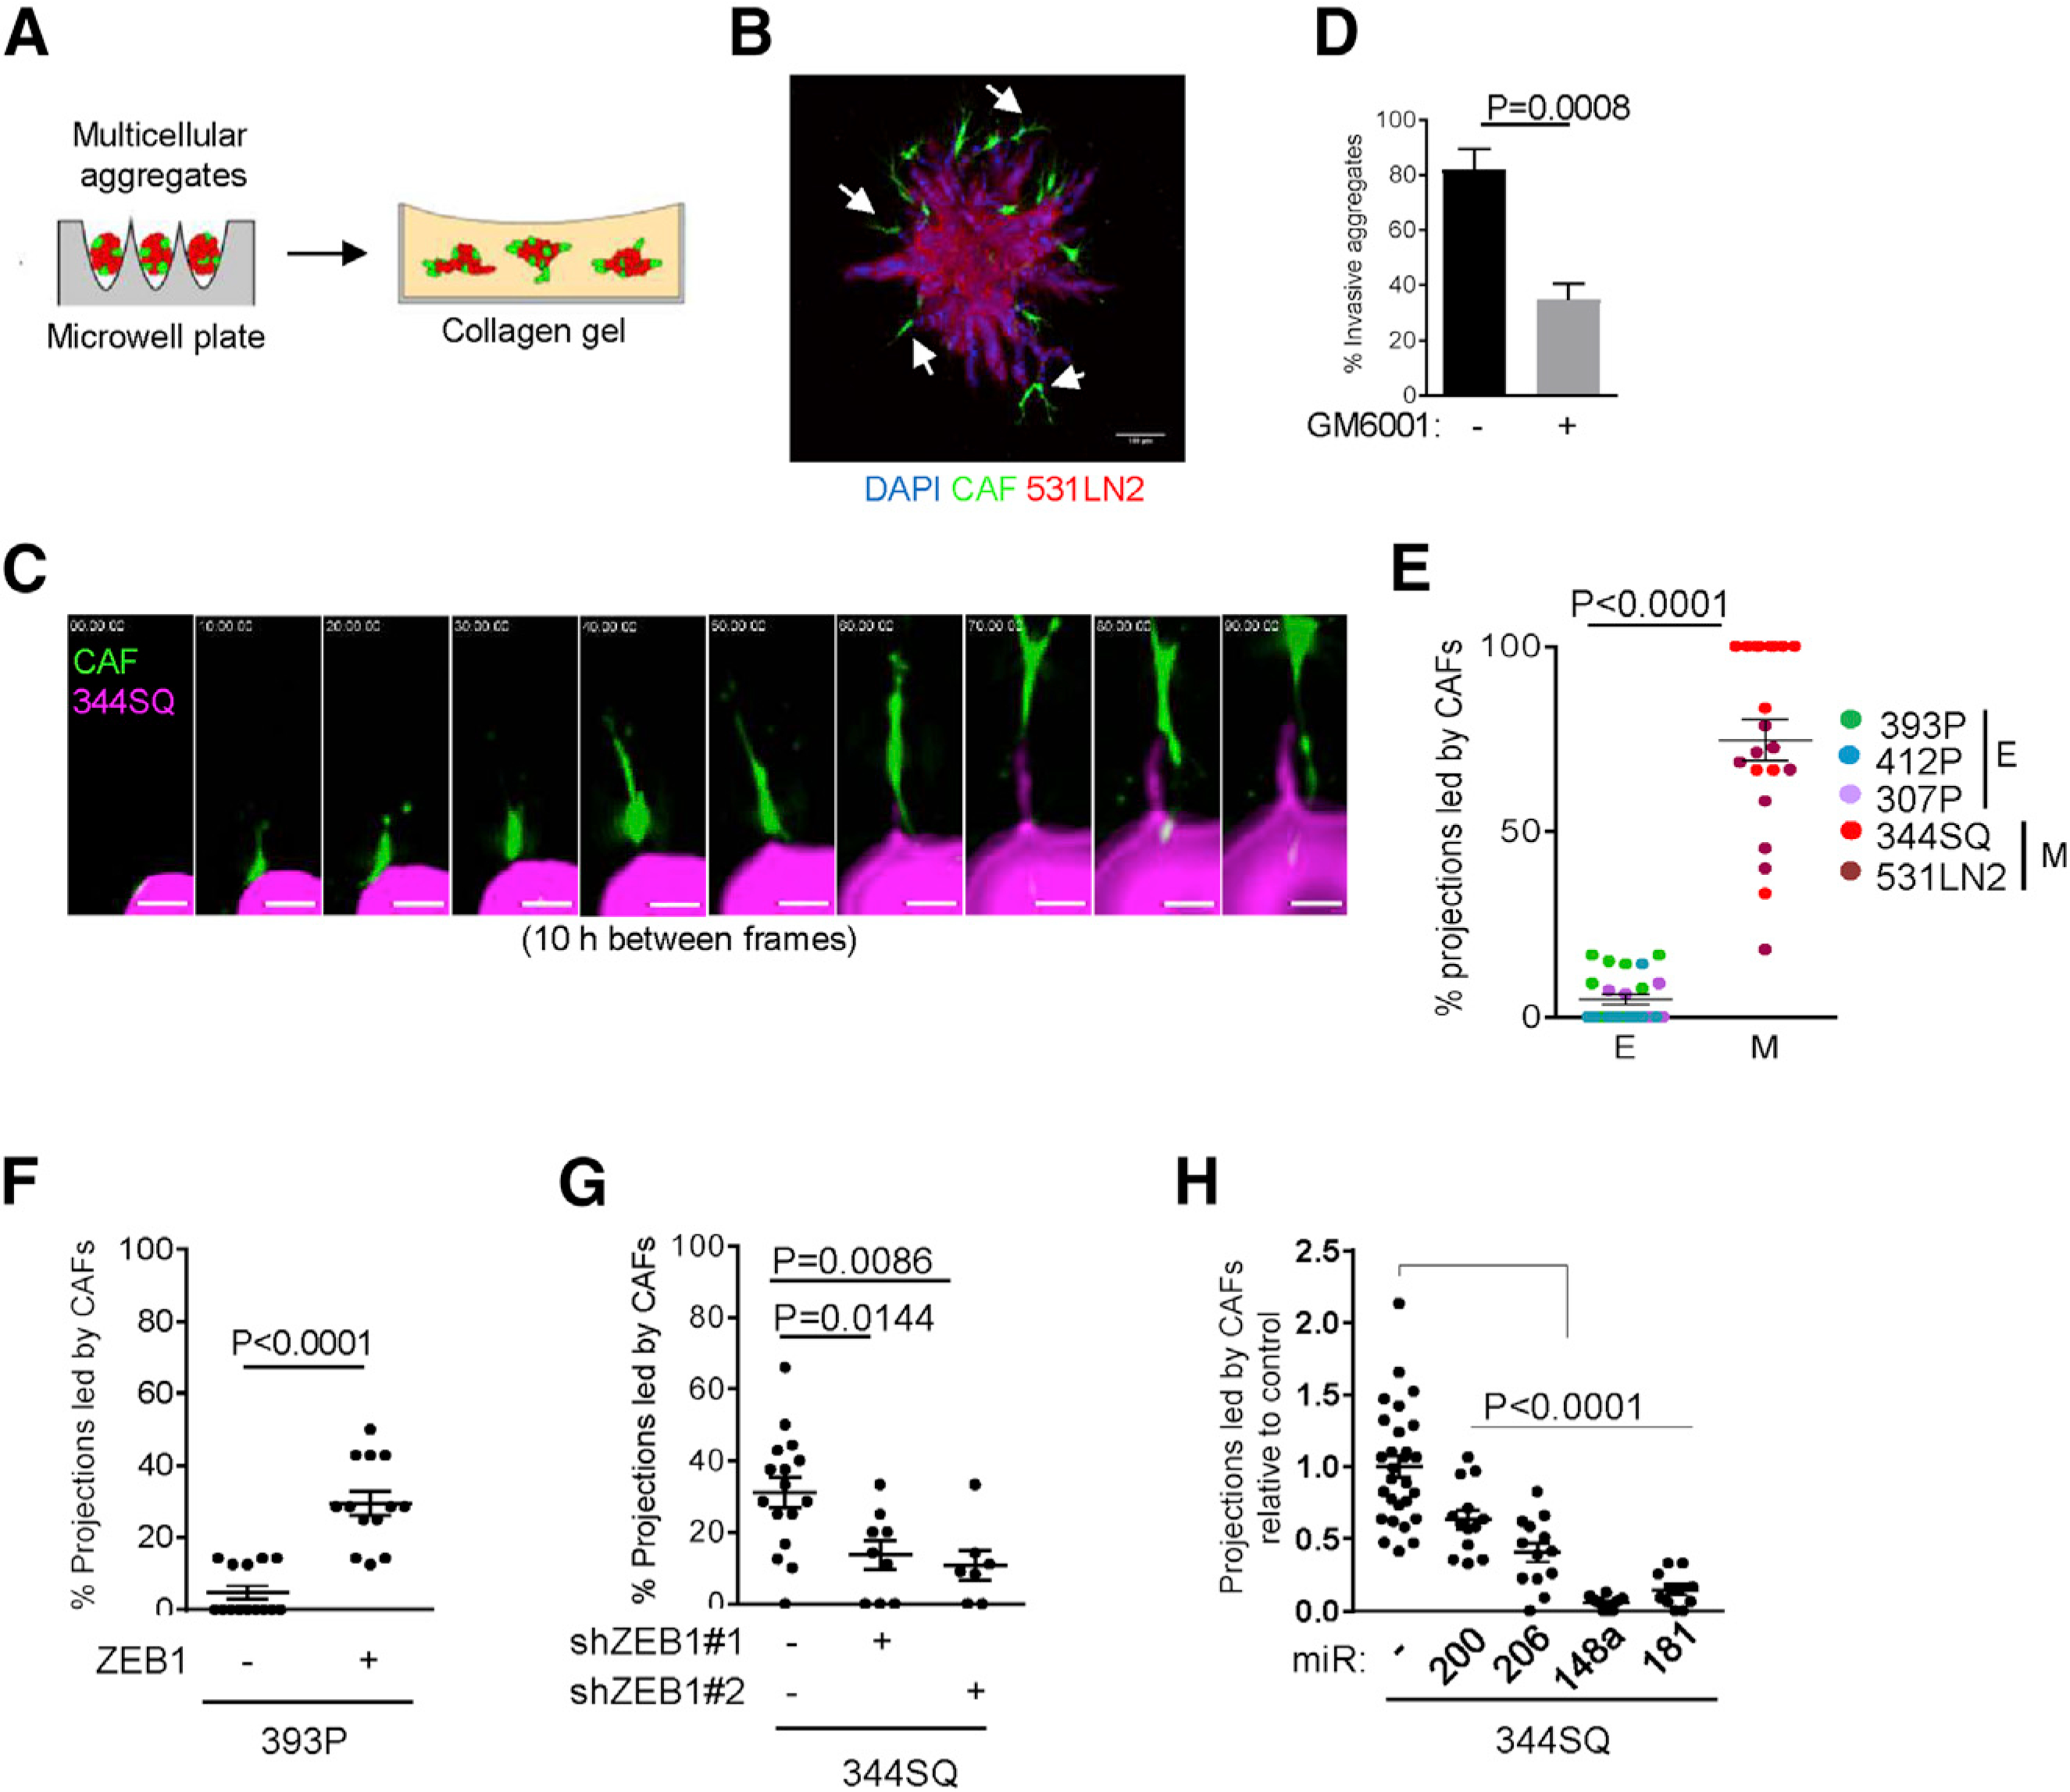
Figure 4. ZEB1 drives tCAF-led invasive structure formation.

(A) Multicellular aggregates generated in microwell plates were transferred to collagen gels for imaging of invasive structure formation.
(B) Confocal micrograph of a multicellular aggregate containing tCAF-led invasive structures (arrows). Scale bar, 100 μm.
(C) Montage of confocal micrographs from live-cell imaging of a multicellular aggregate. tCAF (green), 344SQ cells (magenta). Scale bars, 15 μm.
(D) Percentage of aggregates that develop invasive projections in the presence or absence of protease inhibitor GM6001 (20 μM). n = at least 25 aggregates per condition. p values, Fisher’s exact test.
(E) Percentages of total projections led by tCAFs per multicellular aggregate (dots). n = at least 6 aggregates per cell line. Epithelial (E) or mesenchymal (M) LUAD cell lines. p values, 2-sided t test.
(F–H) Percentages of total projections led by tCAFs per multicellular aggregate (dots). 393P cells stably transfected with ZEB1 (+) or empty vector (−). n = at least 13 aggregates per condition (F). 344SQ cells stably transfected with ZEB1 shRNA (+) or scrambled control shRNA (−). n = at least 7 aggregates per condition. (G) 344SQ cells stably transfected with miRs or empty vector (−). (H) n = at least 11 aggregates per condition.
p values, 2-sided t test, 1-way ANOVA test.
