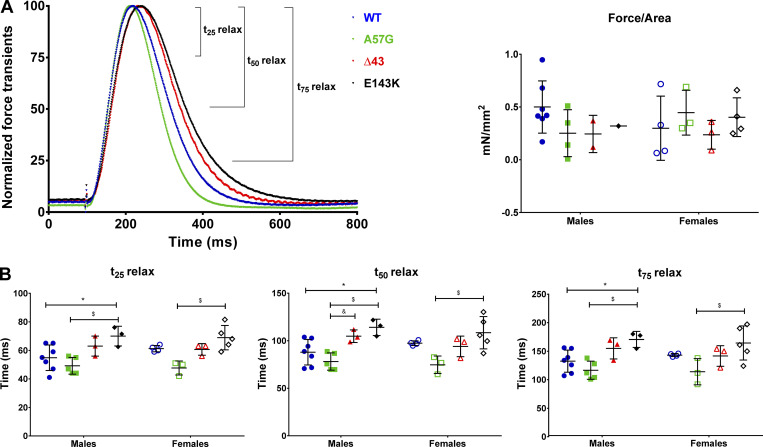
Figure 2.
Force transients in intact PMs from 8–10-mo-old HCM-A57G (5 M and 3 F), Δ43 (3 M and 3 F), and RCM-E143K (3 M and 5 F) compared with WT-ELC (7 M and 4 F). The data for A57G and Δ43 animals were taken, with permission, from Sitbon et al. (2020). (A) Left: Normalized force transients for WT-ELC (blue), HCM-A57G (green), Δ43 (red), and RCM-E143K (black) mice. Right: Force (in millinewtons per square millimeter) was calculated as a ratio of peak force to physiological cross-sectional area (see Materials and methods) and plotted as a function of genotype and sex. (B) Time points t25, t50, and t75 depicting the time (in milliseconds) from peak force to 25%, 50%, and 75% baseline for male and female mice of all genotypes. Open symbols depict female mice, and closed symbols depict male mice. Data are mean ± SD of male or female mice analyzed by two-way ANOVA followed by Tukey’s or Sidak’s multiple comparison test. *, P < 0.05 for mutant versus WT; $, P < 0.05 for A57G versus E143K; and &, P < 0.05 for A57G versus Δ43.

