Figure 7.
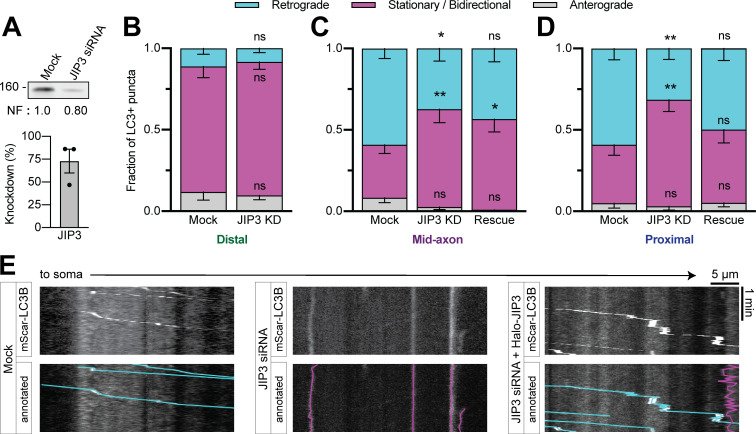
JIP3 regulates autophagosomal motility in the mid- and proximal axon. (A) Immunoblotting and quantification of PC12 cell lysates demonstrate KD efficiency of JIP3 siRNA. n = 3 repeats. Normalization factor (NF) determined using Revert Total Protein Stain. (B–D) Quantification of LC3+ puncta motile behavior in the distal, mid-, and proximal axon. n = 12–19 neurons. Two-way ANOVA for each with Tukey’s multiple comparisons test; mid (retrograde: mock vs. KD, P = 0.0212; mock vs. rescue, P = 0.2045; KD vs. rescue, P = 0.7854; stationary/bidirectional [Stat/Bidir]: mock vs. KD, P = 0.0025; mock vs. rescue, P = 0.0347; KD vs. rescue, P = 0.8816); proximal (retrograde: mock vs. KD, P = 0.0044; mock vs. rescue, P = 0.5203; KD vs. rescue, P = 0.0858; Stat/Bidir: mock vs. KD, P = 0.0021; mock vs. rescue, P = 0.5410; KD vs. rescue, P = 0.0469). (E) Example kymographs showing proximal axon. Bars throughout show mean ± SEM. *, P < 0.05; **, P < 0.01 compared to mock.

