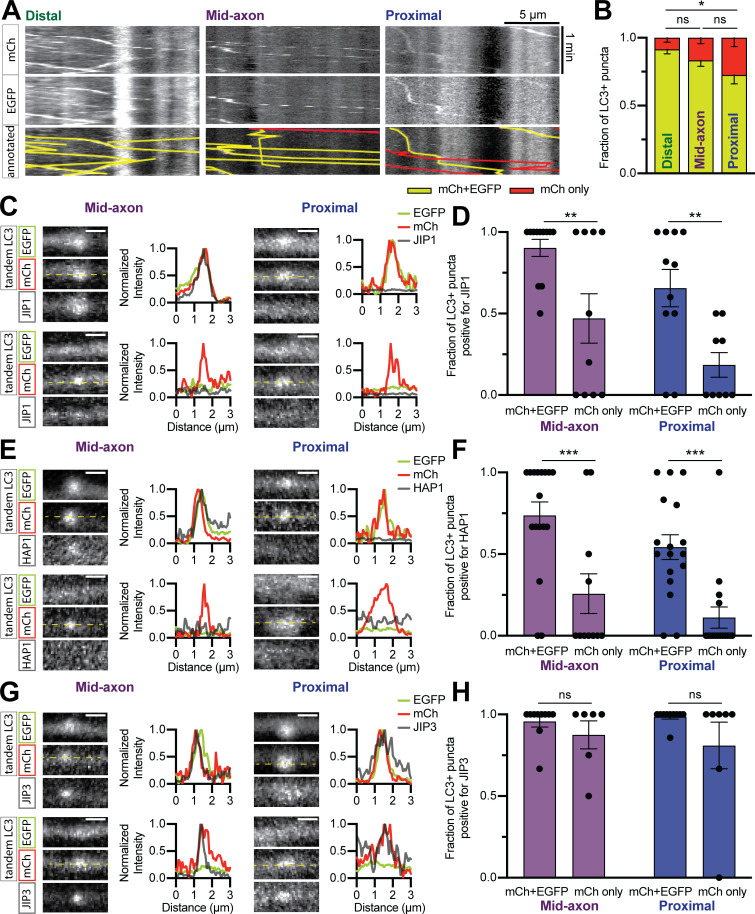
Figure 8.
Dynein effectors exhibit preference for autophagosome maturity. (A and B) Example kymographs and quantification of mCh-EGFP-LC3 in different subaxonal regions. n = 11–12 neurons. Two-way ANOVA with Tukey’s multiple comparisons test (distal vs. mid, P = 0.4452; distal vs. proximal, P = 0.0195; mid vs. proximal, P = 0.2608). (C–H) Example micrographs, line scans, and quantifications showing the colocalization of JIP1 (C and D); HAP1 (E and F); and JIP3 (G and H) with mCh-EGFP-LC3. n = 10–18 neurons. Two-way ANOVA with Sidak’s multiple comparisons test (JIP1: mid, P = 0.0069; proximal, P = 0.0092; HAP1: mid, P = 0.0007; proximal, P = 0.0007; JIP3: mid, P = 0.6893; proximal, P = 0.1700.) Dashed yellow lines represent line scan. Scale bar, 1 µm. Bars throughout show mean ± SEM. *, P < 0.05; **, P < 0.01; ***, P < 0.001.

