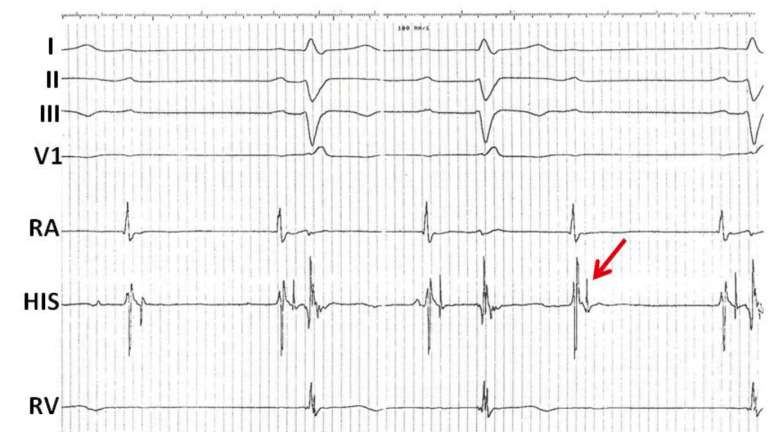
Fig. (3).
Infra-nodal Wenckebach conduction. Intracardiac electrograms demonstrating infra-nodal Wenckebach. Shown are surface leads I, II, III, and V1 as well as intracardiac electrograms from the right atrium (RA), AV node His region (HIS) and the right ventricle (RV). There is a regular atrial rhythm. The first P wave is not conducted; however the second and third P waves are followed by a wide QRS. Each atrial electrogram is followed by a His electrogram in a 1:1 relationship with a stable AH interval. However, the conducted beats demonstrate progressive prolongation in the HV interval until the third beat in the sequence is no longer conducted and is blocked below the His (arrow). This appearance is in keeping with infra-nodal Wenckebach.

