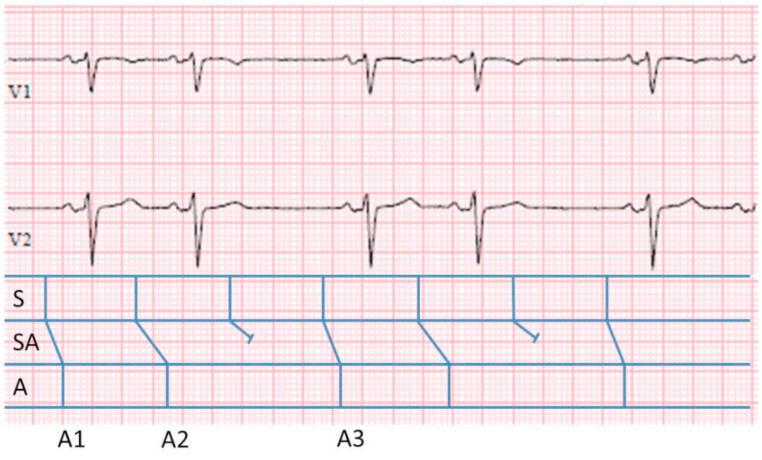
Fig. (4).
3:2 S-A Wenckebach. ECG leads V1 and V2 demonstrating SA nodal Wenckebach with an associated ladder diagram. The classical depiction of the A, AV and V have been replaced by S, SA, A. To calculate the unseen input within the SA node we apply the same (n+1)/n formula. The total cycle length, equal to the interval from A1 to A3 = 1880 ms. During this time there have been a total of 2 outputs and therefore 3 inputs from within the SA node. Therefore, the overall ‘unseen’ input cycle length is 1880/3= 626ms.

