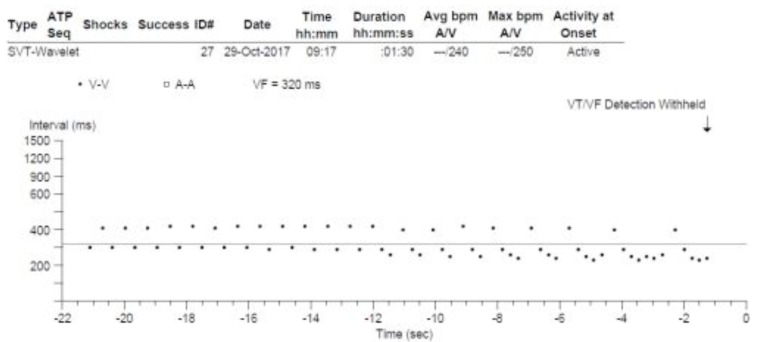
Fig. (6).
Wenckebach conduction demonstrated from the ventricular output of an implantable cardioverter defibrillator. A ventricular interval plot obtained from an implantable cardioverter defibrillator and designated initially by the device as VT/VF. Note the appearance of grouped beating and the classical reduction in the cycle length between successive ventricular beats in the sequence, therefore initially demonstrating ‘typical’ 3:2, 4:3 and 5:4 Wenckebach block. It is not until the final sequences with 6:5 and 8:7 block that the typical behaviour is lost. This Wenckebach behaviour shows that the rhythm is being driven by a regular atrial input and that the ventricular rhythm is actually due to atrial flutter with variable (Wenckebach) conduction.

