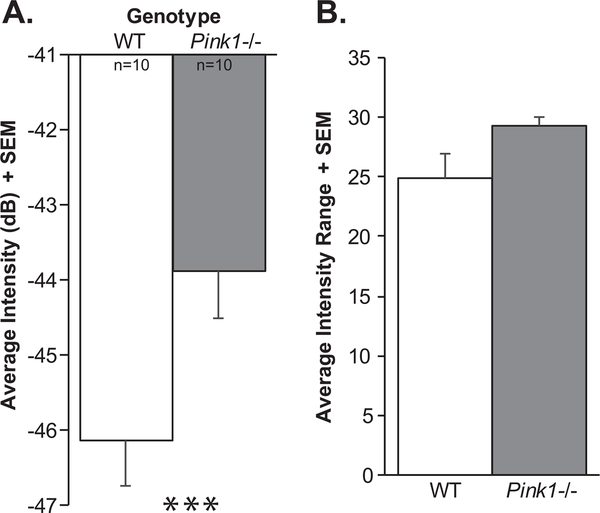
Fig. 7.
Ultrasonic vocalization intensity (loudness). A) Average intensity of vocalizations (decibels, dB) + standard error of the mean (SEM). B) Average range of intensity measures + SEM. Wildtype (WT) = white bar, Pink1−/− = gray bar, n = 10 per genotype. Statistical significance is denoted an asterisk: ***p < 0.001.

